The MACD, or Moving Average Convergence Divergence, stands as one of the most popular momentum indicators in technical analysis. Traders rely on it to spot changes in trend strength, direction, and potential entry or exit points across stocks, forex, cryptocurrencies, and other assets. By comparing two exponential moving averages, the MACD reveals whether short-term momentum accelerates or slows relative to longer-term trends.
This indicator helps filter noise in volatile markets while highlighting genuine shifts in buyer or seller control. Many beginners start with MACD because its visual components—the lines and histogram—offer clear, actionable signals without overwhelming complexity.
Understanding the MACD Components
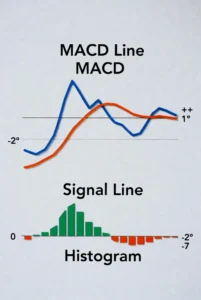
The MACD consists of three main elements displayed together on a chart. The MACD line forms the core, calculated by subtracting the 26-period exponential moving average (EMA) from the 12-period EMA. This difference captures the convergence or divergence between fast and slow price movements.
A signal line overlays the MACD line as a 9-period EMA of the MACD itself. This smoother line acts as a trigger for buy and sell decisions. Finally, the histogram illustrates the gap between the MACD line and signal line. Growing bars indicate strengthening momentum, while shrinking bars suggest it may be fading.
These parts work in harmony. Positive MACD values occur when the 12-period EMA sits above the 26-period EMA, signaling bullish conditions. Negative values point to bearish territory.
How the MACD Calculation Works
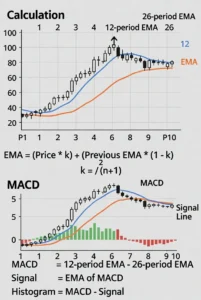
Calculating the MACD starts with the two EMAs. The formula subtracts the longer 26-period EMA from the shorter 12-period EMA to produce the MACD line. Traders then derive the signal line by taking a 9-period EMA of that result. The histogram simply equals the MACD line minus the signal line.
Default settings of 12, 26, and 9 remain widely used because they balance sensitivity and reliability across different timeframes. However, day traders sometimes prefer faster settings like 8, 17, 9 to react quicker to intraday moves, while swing traders often stick closer to the standard parameters.
The zero line serves as a critical reference. Crossings above zero suggest the short-term average has overtaken the long-term one, often confirming an uptrend. Crossings below zero indicate the opposite.
Key Trading Signals from the MACD
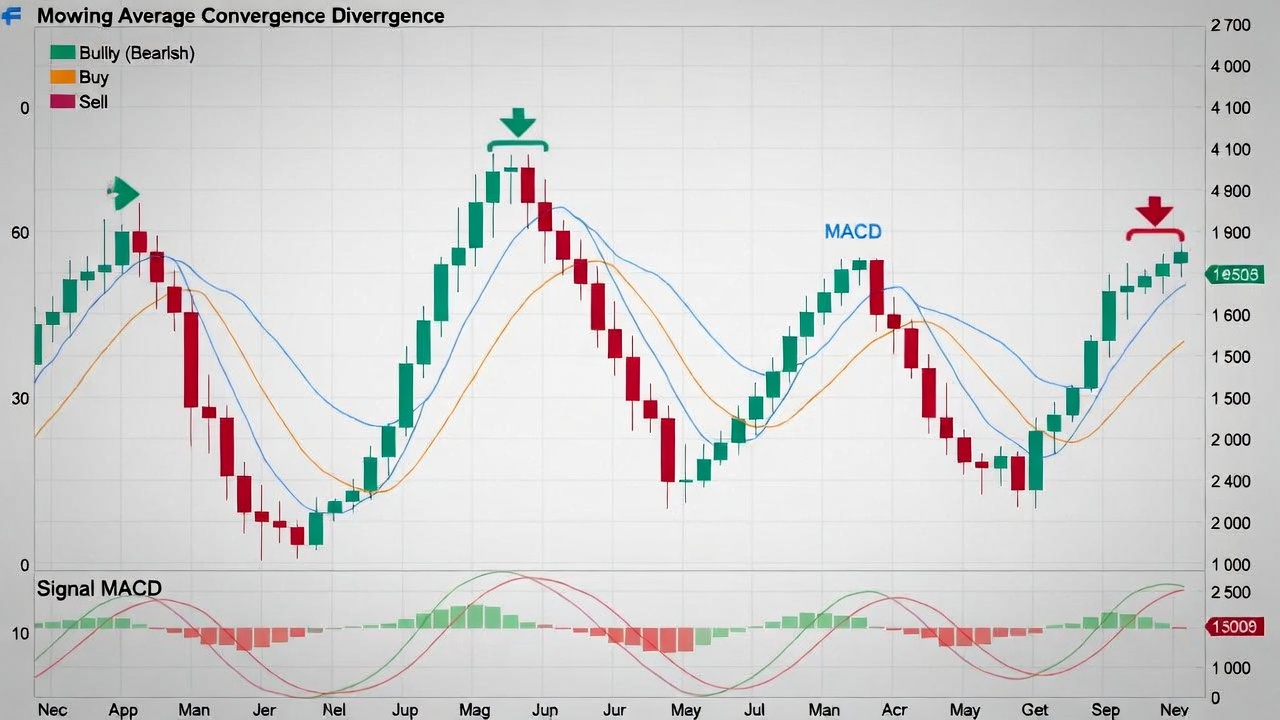
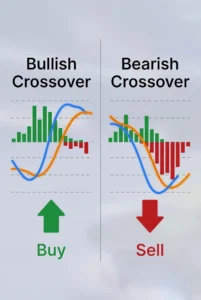
Signal line crossovers provide the most straightforward trades. When the MACD line crosses above the signal line, it generates a bullish signal that often precedes upward price action. Conversely, a cross below signals potential selling pressure.
Zero line crossovers add another layer. A move from below to above zero reinforces bullish momentum, while the reverse warns of weakening trends. The histogram enhances these signals by showing momentum acceleration or deceleration before the lines actually cross.
Divergences represent powerful but subtler clues. Bullish divergence appears when price records lower lows yet the MACD forms higher lows, hinting that downward pressure may soon ease. Bearish divergence occurs with higher price highs paired with lower MACD highs, suggesting exhaustion in the uptrend.
Effective Strategies for Using MACD
Traders often combine MACD with price action or other tools for higher-probability setups. One popular approach involves waiting for a bullish crossover in an overall uptrending market defined by price above a key moving average. This confirmation reduces false signals in ranging conditions.
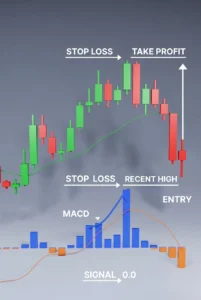
In downtrends, bearish crossovers paired with price below major support levels offer short opportunities. Histogram analysis adds timing precision—enter when expanding bars confirm building momentum and exit as bars begin contracting toward zero.
For swing trading, the standard 12-26-9 settings work well on daily or 4-hour charts. Day traders might test faster variants on shorter intervals but must guard against increased noise. Always align MACD signals with the broader market context rather than trading them in isolation.
Common Pitfalls and How to Avoid Them
Many traders treat MACD as a standalone magic tool, leading to disappointment in sideways markets where whipsaws produce frequent losing signals. Lagging nature means the indicator reacts after price has already moved, so confirmation from volume or support/resistance levels proves essential.
Over-reliance on divergences without context also causes issues. Not every divergence leads to reversal, especially in strong trends. Setting proper stop-losses below recent swing lows for longs or above swing highs for shorts protects capital when signals fail.
Another mistake involves ignoring timeframe alignment. A bullish signal on a 5-minute chart carries little weight if the daily chart shows clear bearish MACD positioning. Multi-timeframe analysis helps filter higher-quality trades.
Integrating MACD with Other Indicators
Pairing MACD with the Relative Strength Index (RSI) creates a robust system. While MACD excels at trend and momentum confirmation, RSI identifies overbought or oversold extremes more directly. A bullish MACD crossover combined with RSI rising from below 30 often yields stronger entries than either indicator alone.
Volume analysis further validates signals. Rising volume during a bullish MACD crossover adds conviction that real buying interest supports the move. Support and resistance levels or candlestick patterns provide additional context for better risk-reward setups.
Experienced traders also experiment with custom settings tailored to specific assets or market conditions, though thorough backtesting remains crucial before live deployment.
Mastering MACD for Better Trading Decisions
The MACD delivers valuable insights into momentum shifts that pure price charts sometimes obscure. Its visual simplicity makes it accessible for newcomers, yet layered signals reward deeper study and disciplined application.
Success with MACD comes from treating it as one piece of a complete trading plan rather than a universal solution. Focus on high-probability setups where multiple factors align, manage risk consistently, and continually refine your approach through practice and review.
By understanding its strengths and limitations, traders can harness the MACD to navigate trends more confidently and improve overall timing in dynamic markets.