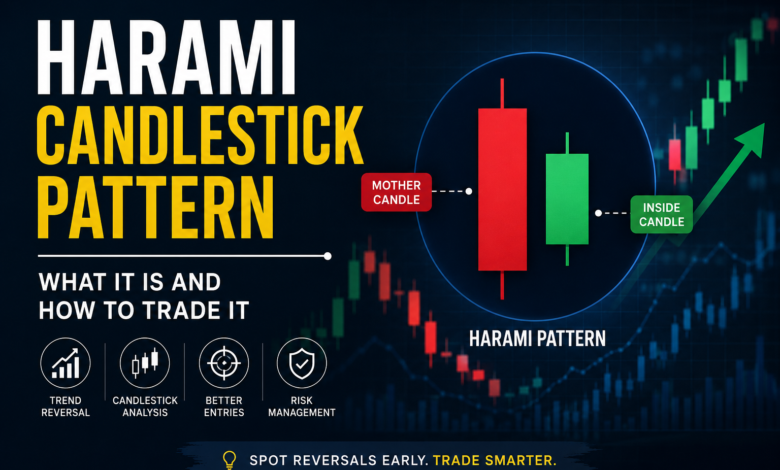
The harami candlestick pattern is a two candlestick pattern that may signal a pause or reversal in price momentum. It…
Read More »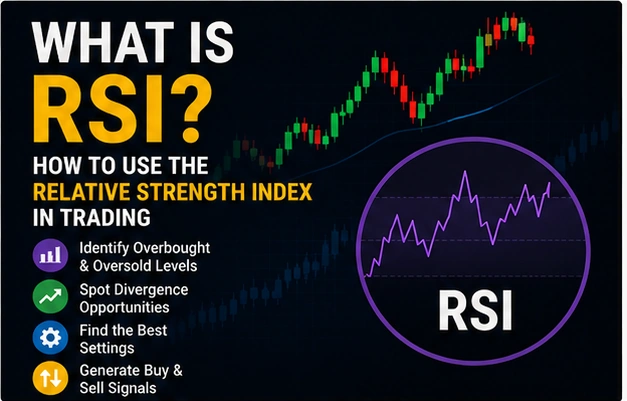
What Is the RSI Indicator? The RSI indicator, short for Relative Strength Index, is one of the most widely used…
Read More »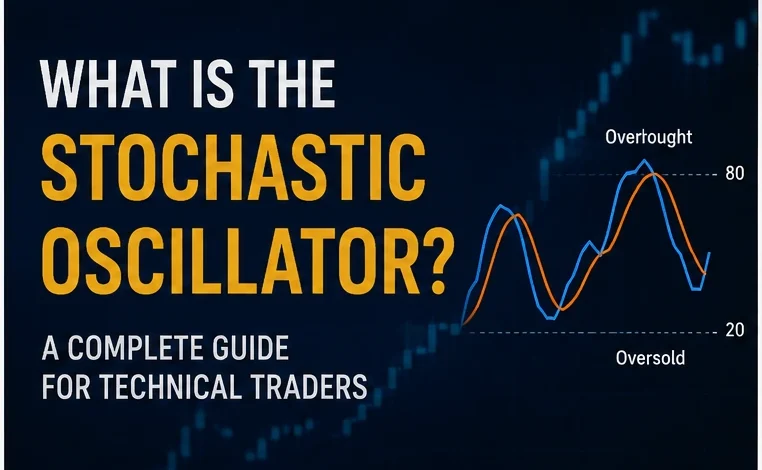
What Is the Stochastic Oscillator? The stochastic oscillator is one of the most popular momentum indicators used in technical analysis.…
Read More »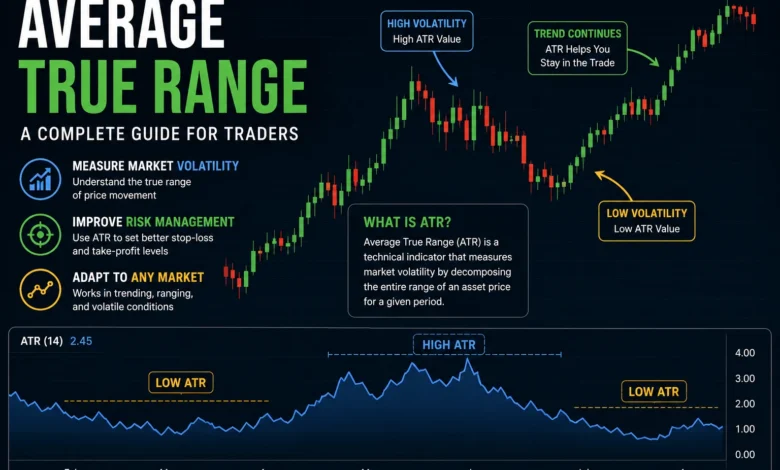
Average True Range Explained: How Traders Use ATR to Manage Volatility Volatility is the heartbeat of every market. Without understanding…
Read More »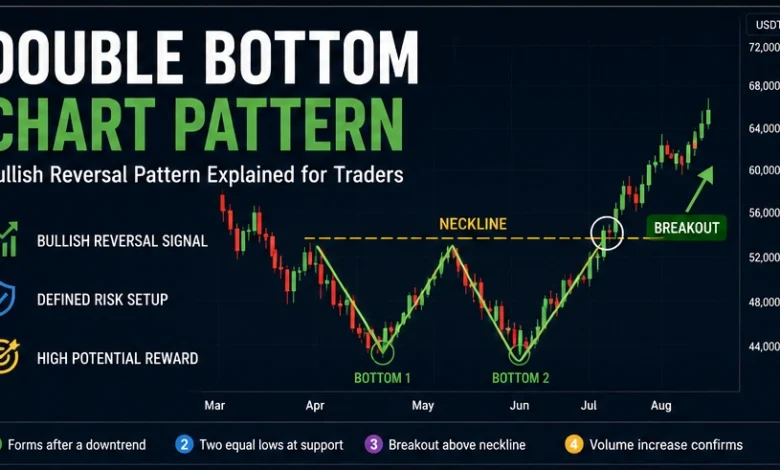
The double bottom chart pattern is one of the most popular bullish reversal formations used in technical analysis. Traders rely…
Read More »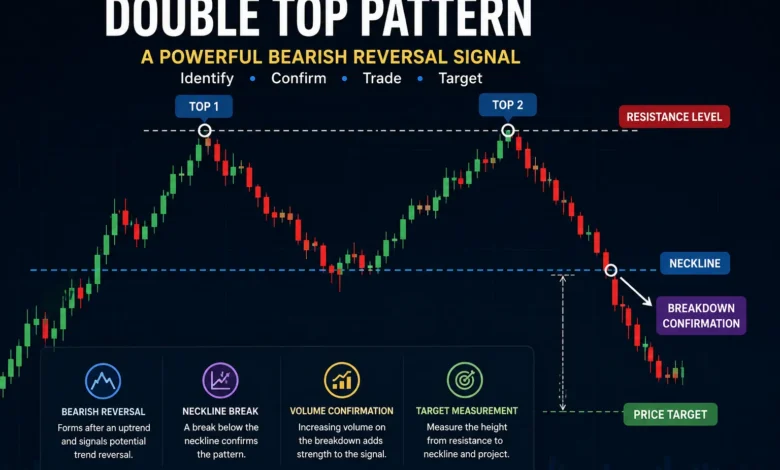
What Is a Double Top Pattern? A double top pattern is a bearish reversal pattern that usually forms after a…
Read More »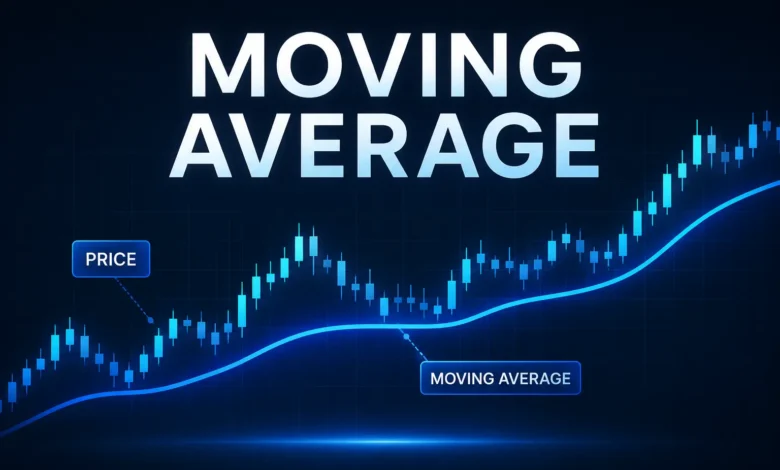
A moving average is one of the most widely used tools in trading because it simplifies price action. It removes…
Read More »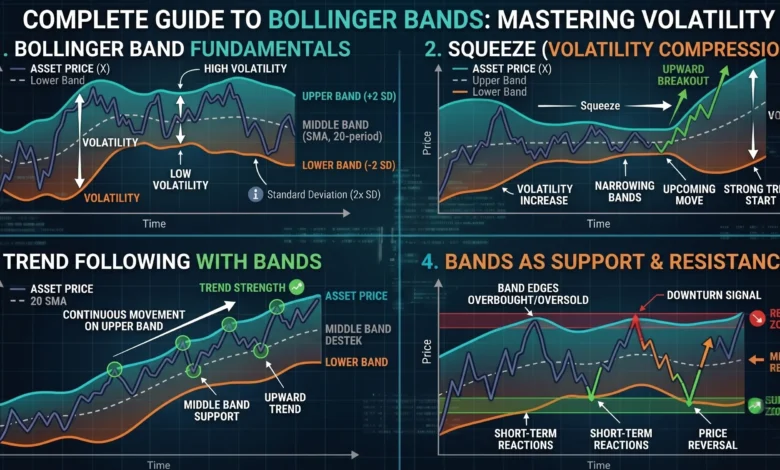
Bollinger Bands Bollinger Bands are one of the most widely used technical indicators in financial markets, yet they’re frequently misread.…
Read More »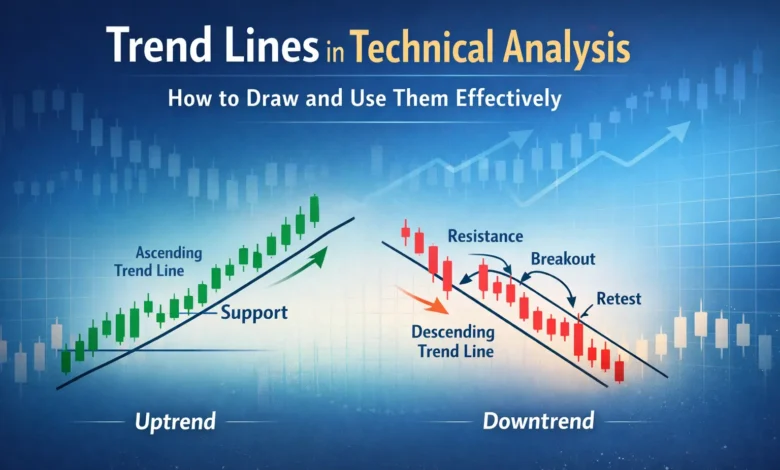
Trend lines are one of the simplest yet most powerful tools in technical analysis. Whether you are trading stocks, crypto,…
Read More »
The rectangle pattern ranks among the clearest and most reliable formations in technical analysis. It appears when price moves sideways…
Read More »