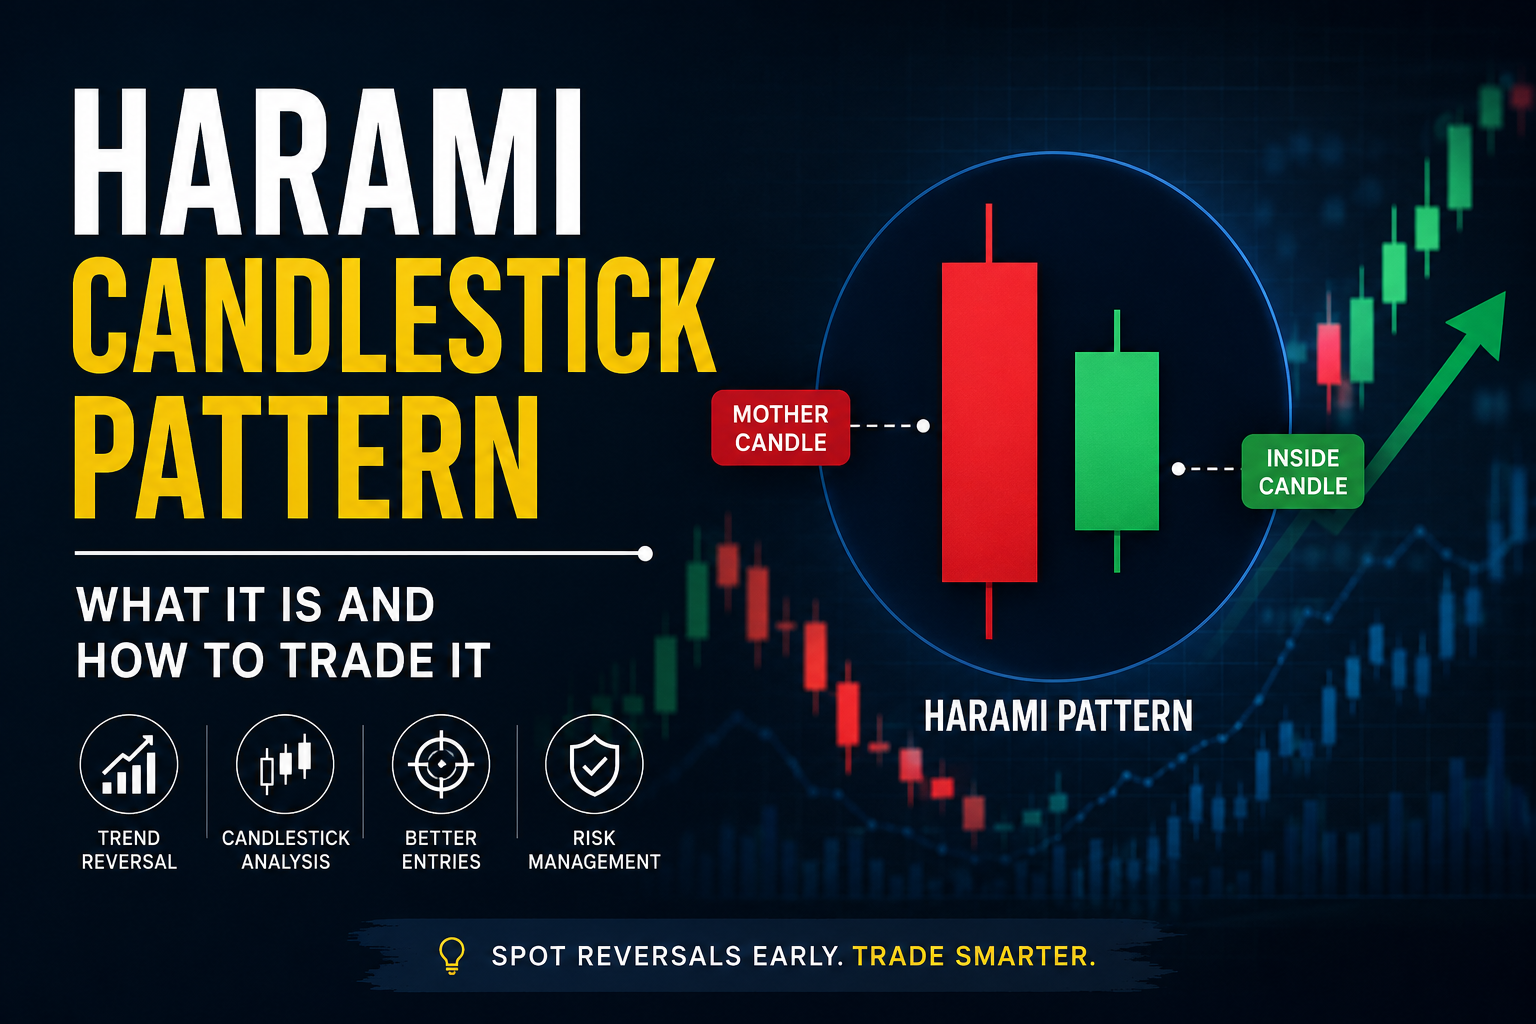
Harami Candlestick Pattern: What It Is and How to Trade It
The harami candlestick pattern is a two candlestick pattern that may signal a pause or reversal in price momentum. It forms when a large first candle, often called the mother candle, is followed by a smaller second candle whose real body sits inside the first candle’s body.
A bullish harami appears after a downtrend and may suggest buyers are returning.
A bearish harami appears after an uptrend and may suggest sellers are gaining control. Traders usually wait for harami signal confirmation before entering a trade because the pattern alone can be weak.
What Is a Harami Candlestick Pattern?
The harami candlestick pattern is a Japanese candlestick formation used to spot possible trend exhaustion. It does not promise a reversal. It shows that the current move may be losing strength.
A valid harami candle has two parts. The first candle is large. The second candle is smaller and sits inside the real body of the first candle.
This pattern is popular in stocks, forex, commodities, indices, and crypto. The same logic applies to a harami candle crypto setup or a harami candle forex setup. The market must first show a clear trend.
The Origin and Meaning of “Harami”
The word harami comes from Japanese and is commonly explained as “pregnant.” The name describes the visual shape of the pattern. The large first candle looks like the mother, while the smaller second candle looks contained inside it.
Japanese candlestick analysis became widely known in Western markets through writers and analysts such as Steve Nison. Candlestick charts themselves are linked to older Japanese trading methods and are now a core part of modern technical analysis.
How to Identify a Harami Pattern
To identify a harami pattern, first look for an existing trend. A bullish setup needs a prior downtrend. A bearish setup needs a prior uptrend.
The second candle should show hesitation. It may be bullish, bearish, or nearly flat. What matters most is its position inside the first candle’s real body.
The Mother Candle and the Inside Candle
The first candle is the mother candle. It represents the dominant side of the market.
In a downtrend, a large bearish mother candle shows that sellers are still strong. If the next candle becomes small and contained, selling pressure may be fading.
In an uptrend, a large bullish mother candle shows buyer strength. If the next candle is small and contained, buyer momentum may be slowing.
The second candle is the inside candle formation. It reflects uncertainty, compression, and possible momentum change.
Key Rules for a Valid Harami Formation
A clean harami reversal pattern should meet these rules:
| Rule | What to Look For |
|---|---|
| Existing trend | Downtrend for bullish harami, uptrend for bearish harami |
| Large first candle | Strong body in the direction of the trend |
| Small second candle | Body contained inside the first candle’s body |
| Market context | Support, resistance, volume, RSI, or stochastic confirmation |
| No blind entry | Wait for price confirmation before trading |
The second candle’s wicks may extend beyond the first candle in some charting methods. Still, many traders prefer the second candle’s body to remain clearly inside the first candle’s body for a cleaner signal.
Bullish Harami Pattern
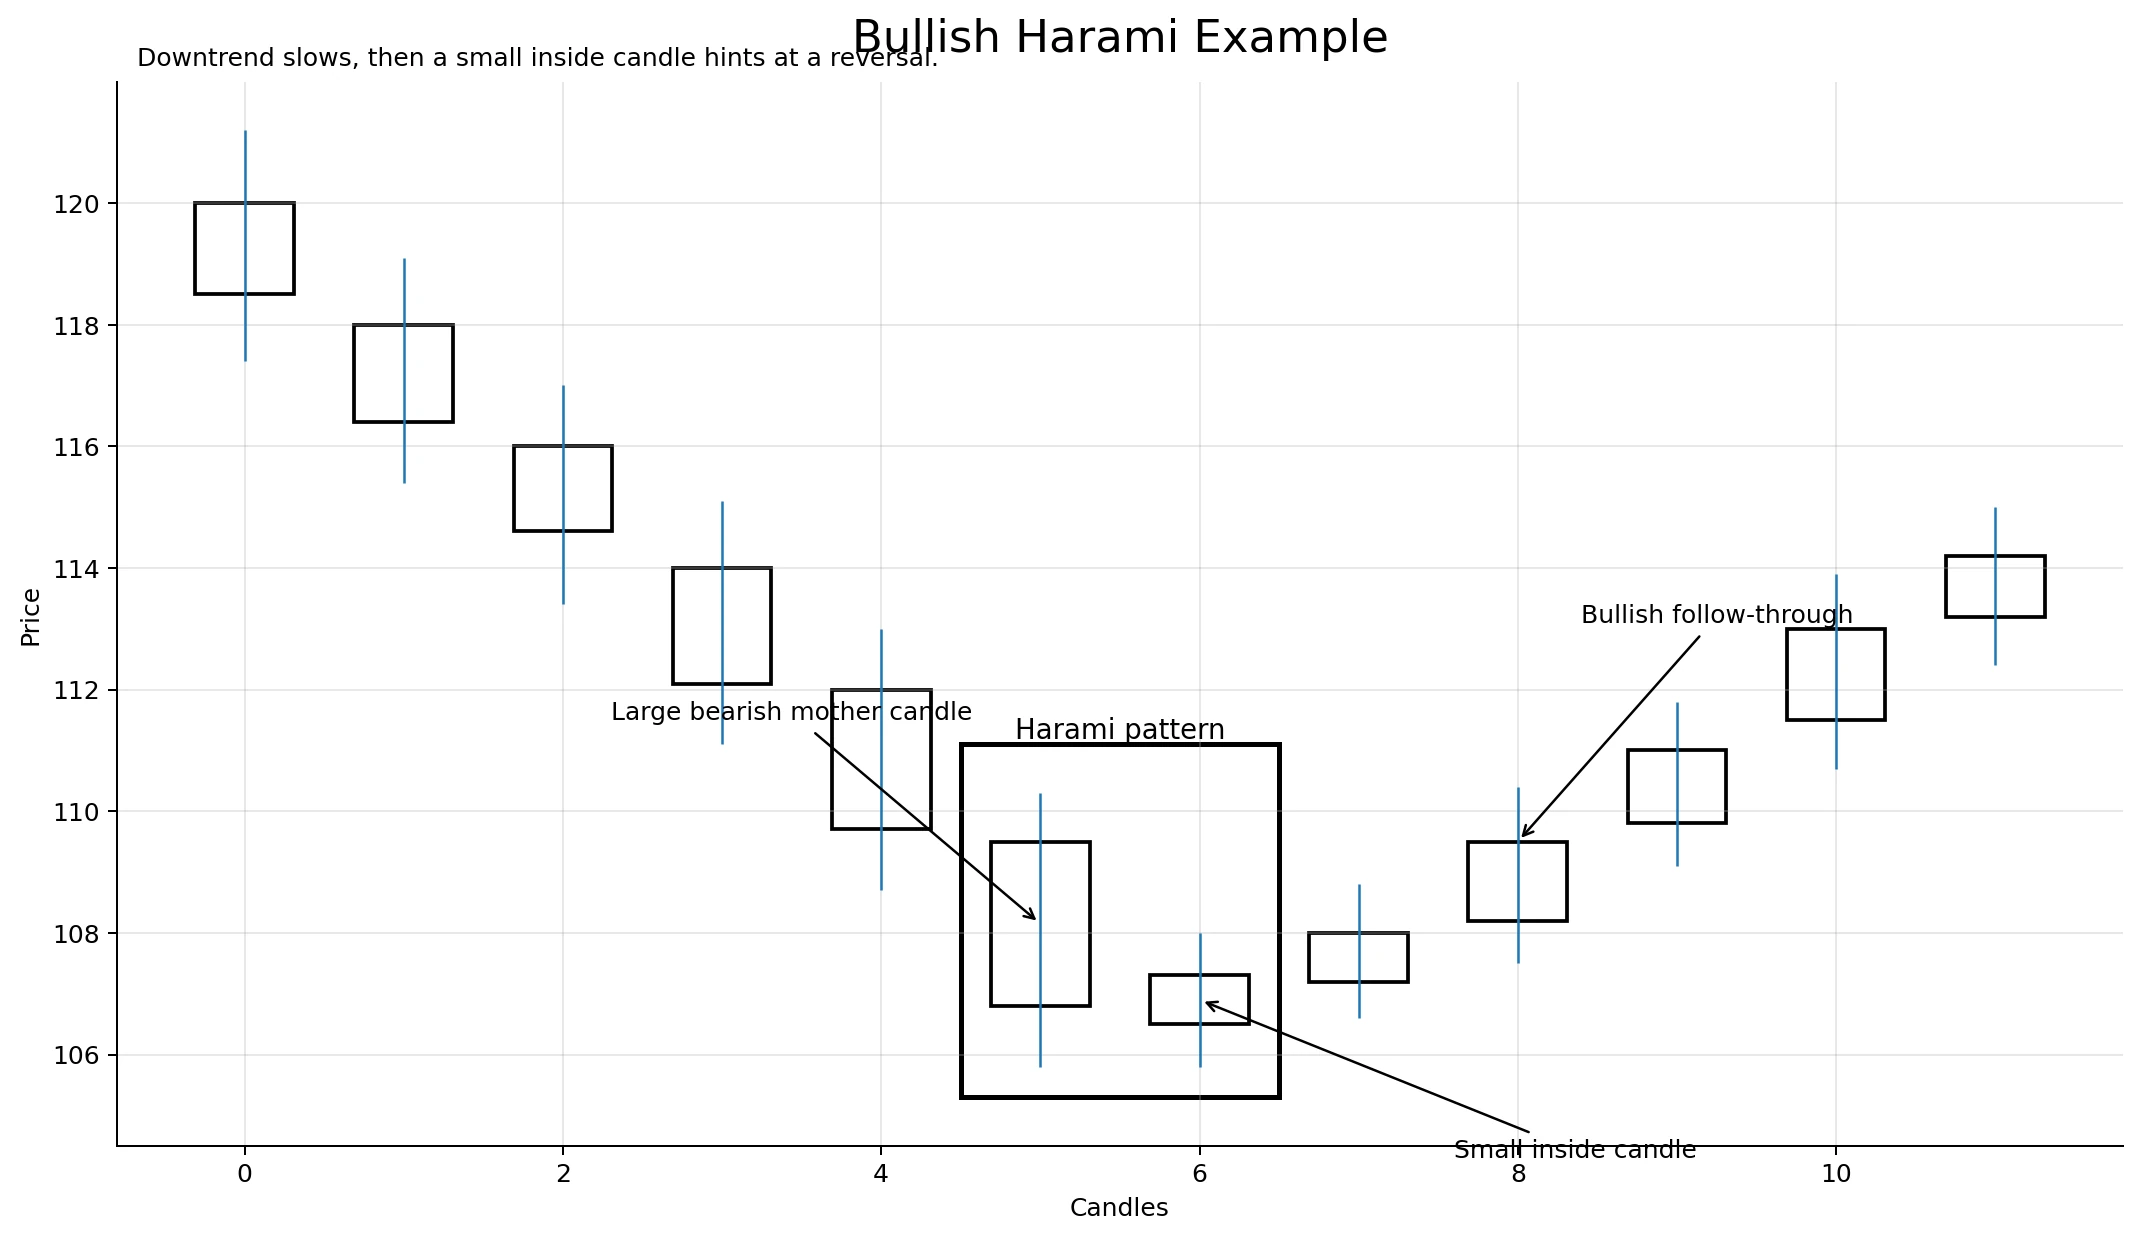
A bullish harami forms after a decline. It starts with a large bearish candle. The next candle is smaller and sits inside the first candle’s body.
This setup suggests sellers may be losing control. It does not mean buyers have fully taken over yet.
What Does a Bullish Harami Signal?
A bullish harami signals possible downside exhaustion. It often appears near support, after a sharp sell-off, or when RSI shows oversold conditions.
The pattern becomes more useful when the next candle closes above the high of the inside candle. This shows that buyers are willing to push price higher.
In simple terms, the market says: “Sellers made a strong move, but they could not continue it.”
How to Trade the Bullish Harami
A practical harami pattern trading plan starts with confirmation. Many traders enter only after price breaks above the high of the second candle.
A basic bullish harami setup may look like this:
Trading Element Example Approach
| Trading Element | Example Approach |
|---|---|
| Entry | Buy after a close above the inside candle high |
| Stop loss | Place below the mother candle low |
| Target | Use nearby resistance or a risk-to-reward target |
| Confirmation | RSI oversold turn, stochastic crossover, or higher volume |
The stop loss harami method matters because false reversals are common. A tight stop below the second candle may be too close in volatile markets. A stop below the mother candle gives the trade more room.
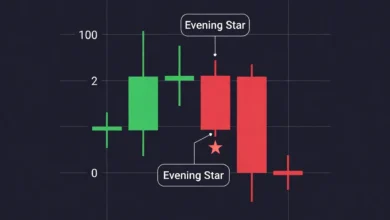
Bearish Harami Pattern
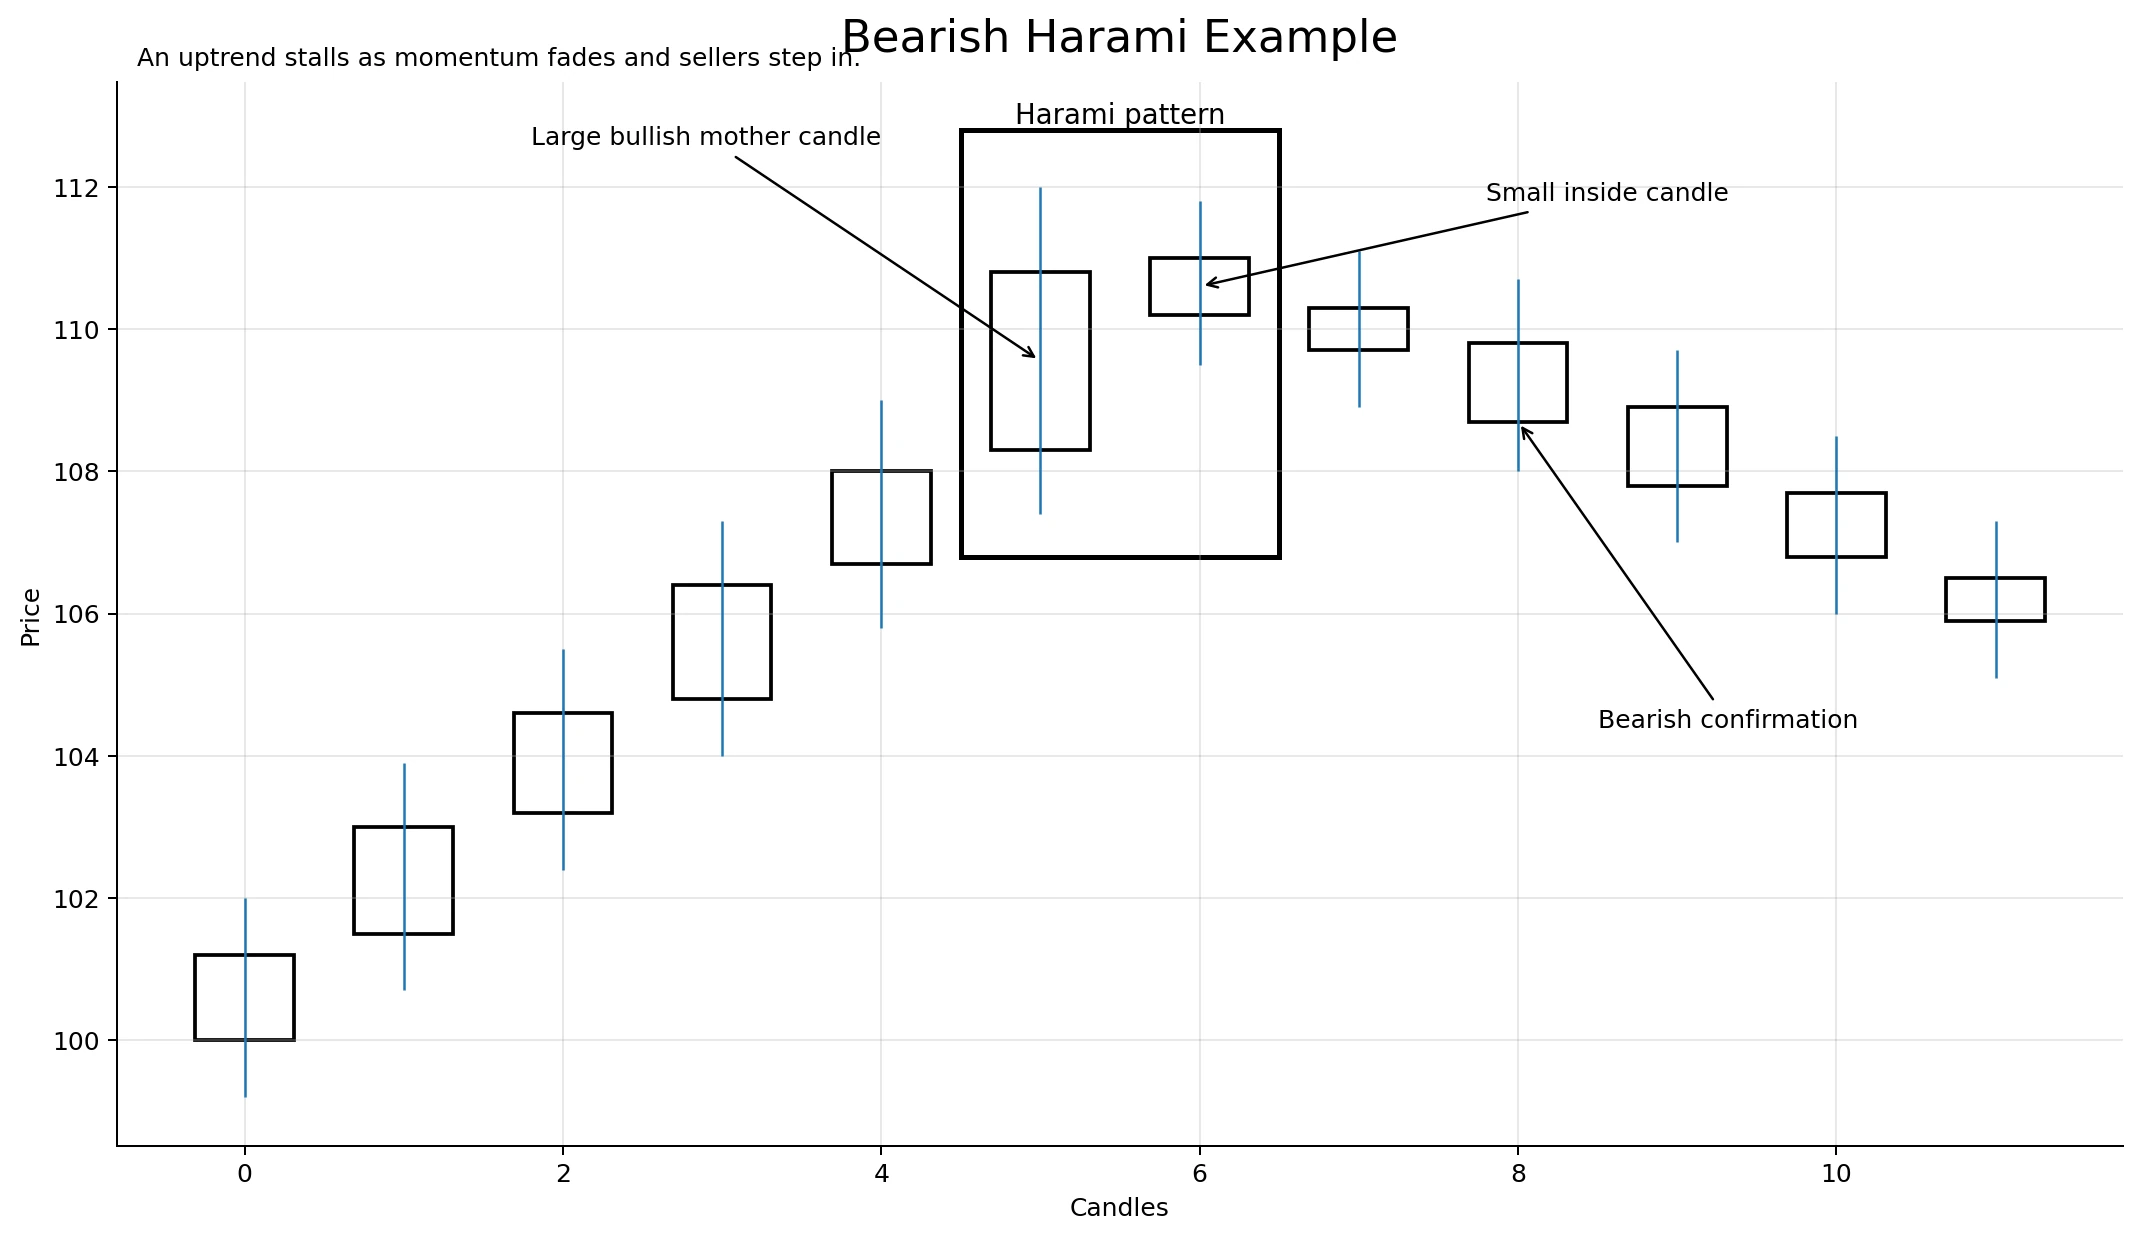
A bearish harami forms after a price rise. It starts with a large bullish candle. The second candle is smaller and sits inside the first candle’s body.
This setup suggests buyers may be losing strength. It can mark the early stage of a possible downside reversal.
What Does a Bearish Harami Signal?
A bearish harami signals possible upside exhaustion. It often appears near resistance, after a fast rally, or when RSI shows overbought conditions.
The pattern becomes stronger when the next candle breaks below the low of the inside candle. This confirms that sellers are entering the market.A bearish harami is best viewed as a warning sign. It is not a sell signal by itself.
How to Trade the Bearish Harami
A simple bearish harami trade waits for downside confirmation.
| Trading Element | Example Approach |
|---|---|
| Entry | Sell or short after a close below the inside candle low |
| Stop loss | Place above the mother candle high |
| Target | Use support, prior swing low, or risk-to-reward target |
| Confirmation | RSI overbought turn, stochastic bearish crossover, or resistance rejection |
Investopedia notes that traders often combine bearish harami patterns with tools such as RSI, stochastic, moving averages, and support or resistance instead of relying on the pattern alone.
Harami Cross: The Doji Variant
The harami cross pattern is a stronger hesitation signal. It forms when the second candle is a doji or almost a doji.
A doji harami cross shows that the market opened and closed near the same price. This means neither buyers nor sellers had full control during that candle.
The harami cross can appear as bullish or bearish. The context decides the meaning.
After a downtrend, a harami cross may show seller exhaustion. After an uptrend, it may show buyer exhaustion.
Harami vs Inside Bar: What’s the Difference?
The inside bar candlestick and the harami look similar, but they are not always the same.
A harami focuses mainly on the candle bodies. An inside bar focuses on the full high-low range.
Feature Harami Pattern Inside Bar
| Feature | Harami Pattern | Inside Bar |
|---|---|---|
| Main focus | Real candle bodies | Full candle range |
| Common use | Reversal signal | Breakout or continuation setup |
| Market meaning | Momentum pause | Volatility compression |
| Best context | Trend exhaustion | Trend continuation or breakout zone |
A harami is more common in candlestick reversal analysis. An inside bar is more common in price action breakout trading.
Confirmation: Should You Wait for the Next Candle?
Yes, most traders should wait. The harami signal confirmation is often more important than the pattern itself.
A confirmation candle helps reduce false entries. It shows whether the market is actually reversing or only pausing.
For bullish harami confirmation, look for a close above the inside candle high. For bearish harami confirmation, look for a close below the inside candle low.
Extra confirmation can come from:
| Confirmation Tool | Bullish Clue | Bearish Clue |
|---|---|---|
| Support and resistance | Pattern forms near support | Pattern forms near resistance |
| RSI | Turns up from oversold | Turns down from overbought |
| Stochastic | Bullish crossover | Bearish crossover |
| Volume | Rising buying volume | Rising selling volume |
| Trendline | Break above short-term downtrend | Break below short-term uptrend |
This is why the candlestick reversal pattern works best inside a complete trading plan.
Harami Pattern with RSI and Stochastic
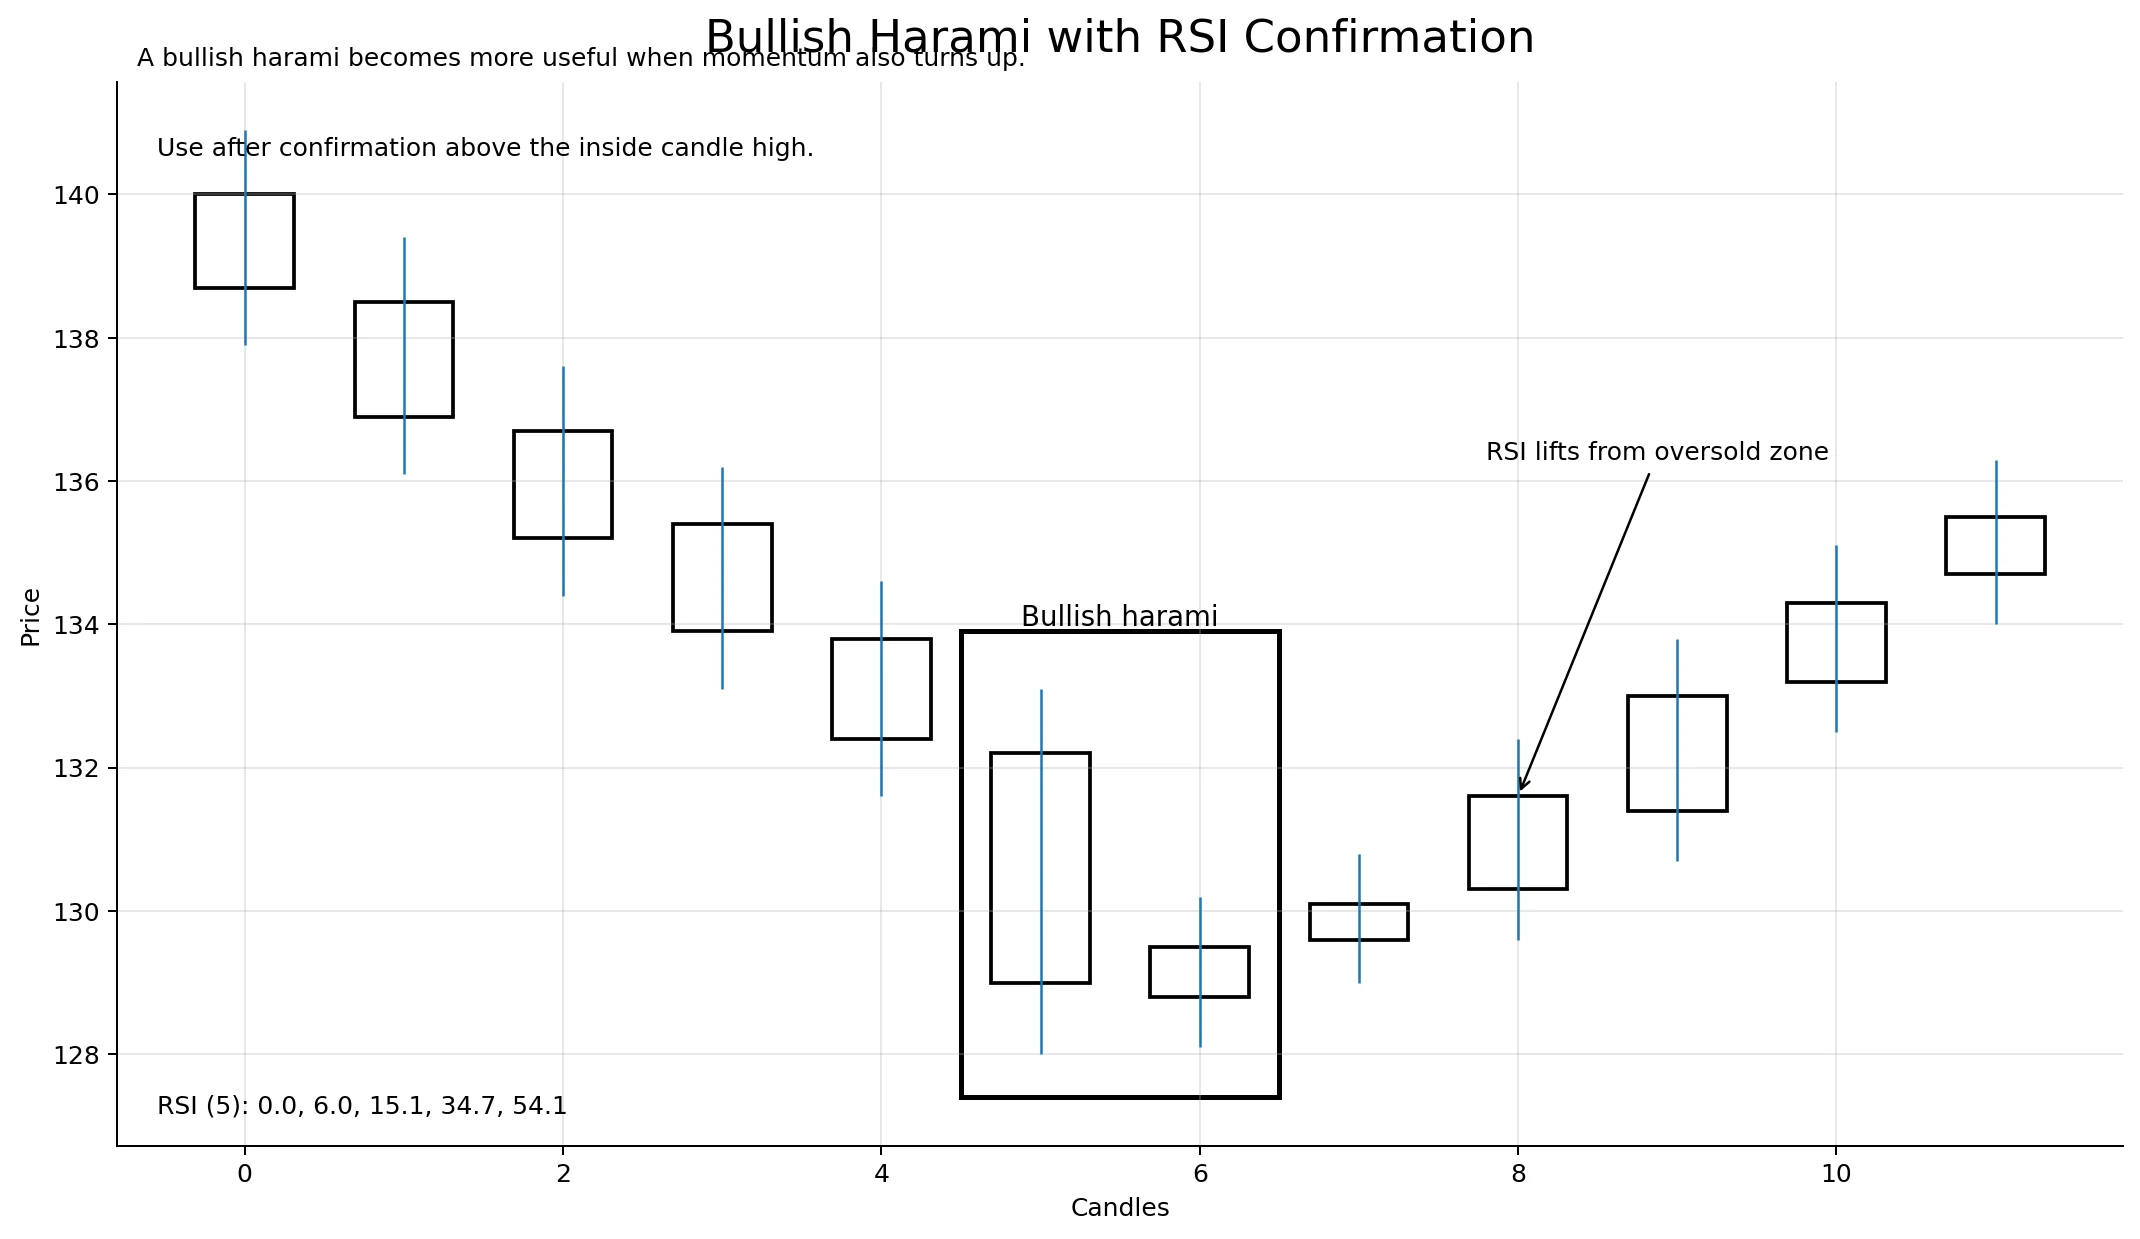
RSI and stochastic can improve decision-making. They help traders judge whether price is stretched.
A bullish harami near support becomes more interesting when RSI is oversold. A stochastic bullish crossover can add another layer of confirmation.
A bearish harami near resistance becomes more interesting when RSI is overbought. A stochastic bearish crossover can support the reversal idea.
Do not use indicators as decoration. Each tool must answer a clear question.
RSI answers: “Is price stretched?”
Stochastic answers: “Is short-term momentum turning?”
The harami answers: “Is the current candle structure losing momentum?”
Common Mistakes When Trading Harami
The biggest mistake is trading every harami candle without context. A harami in the middle of a choppy range has little value.
Another mistake is entering before confirmation. The second candle only shows hesitation. It does not prove reversal.
Many traders also ignore the larger trend. A bullish harami against a strong downtrend can fail quickly. A bearish harami against a strong uptrend can also fail.
Poor stop placement is another issue. A stop placed too close can be triggered by normal market noise.
The final mistake is using the same rules across every market. Forex, crypto, and stocks can behave differently. Crypto often has sharper wicks and more fakeouts, while forex may respect session timing and liquidity zones.
Practical Trading Checklist
Use this short checklist before trading the harami candlestick pattern:
| Question | Why It Matters |
|---|---|
| Is there a clear prior trend? | Harami needs trend context |
| Is the second body inside the first body? | Confirms structure |
| Is price near support or resistance? | Adds market context |
| Did the next candle confirm direction? | Reduces false signals |
| Is risk defined before entry? | Protects capital |
| Does RSI or stochastic support the idea? | Adds momentum confirmation |
A good harami trade is not just a pattern. It is a pattern, a location, confirmation, and risk control.
Frequently Asked Questions
Is the harami candlestick pattern bullish or bearish?
It can be both. A bullish harami appears after a downtrend and may signal a move higher. A bearish harami appears after an uptrend and may signal a move lower.
Is a harami pattern reliable?
It is moderately useful with confirmation. It is weak when traded alone. The pattern works better with support, resistance, volume, RSI, stochastic, or a higher-timeframe trend filter.
What is the difference between harami and engulfing?
A harami has a small second candle inside the first candle’s body. An engulfing pattern is the opposite. In an engulfing pattern, the second candle’s body covers the first candle’s body.
Can I use the harami candle in crypto trading?
Yes. A harami candle crypto setup can work, but crypto markets often create stronger wicks and false breakouts. Confirmation and stop loss placement are especially important.
Can I use the harami candle in forex?
Yes. A harami candle forex setup can work well near session highs, session lows, support, resistance, or major liquidity zones. Avoid trading it during low-volume periods.
Is the harami cross better than the normal harami?
The harami cross pattern can show stronger indecision because the second candle is a doji. Still, it needs confirmation. A doji alone is not a complete trade signal.
Where should I place a stop loss on a harami trade?
For bullish trades, many traders place the stop loss below the mother candle low. For bearish trades, many place it above the mother candle high. This keeps the setup tied to the structure of the pattern.
Does harami work on lower timeframes?
It can, but lower timeframes create more noise. The pattern is usually cleaner on higher timeframes such as 1-hour, 4-hour, daily, or weekly charts.