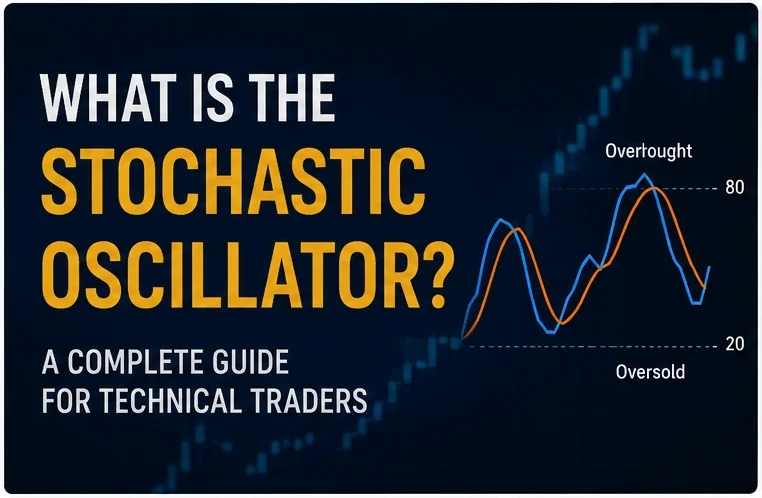
What Is the Stochastic Oscillator? A Complete Guide for Technical Traders
What Is the Stochastic Oscillator?
The stochastic oscillator is one of the most popular momentum indicators used in technical analysis. Developed to measure the relationship between a security’s closing price and its recent price range, the indicator helps traders identify potential trend reversals, overbought conditions, and oversold opportunities.
If you have ever wondered what is stochastic indicator and why it remains widely used across stocks, forex, and cryptocurrency markets, the answer lies in its ability to reveal changes in momentum before price direction changes become obvious.
Unlike trend-following indicators, the stochastic oscillator focuses on closing price momentum, making it a valuable tool for detecting potential turning points in the market.
George Lane and the Origins of Stochastic
The stochastic oscillator was created by George Lane in the late 1950s. Lane believed that momentum changes before price changes. His George Lane indicator was designed to track where the closing price sits relative to a recent trading range.
According to Lane, when momentum begins to weaken, a market reversal often follows shortly after. This principle remains the foundation of modern stochastic trading strategies.
How Does the Stochastic Indicator Work?
The stochastic oscillator compares the latest closing price to the highest and lowest prices over a selected period. This comparison creates a price range oscillator that fluctuates between 0 and 100.
When prices close near the top of their recent range, the indicator moves higher. When prices close near the bottom of the range, the indicator moves lower.
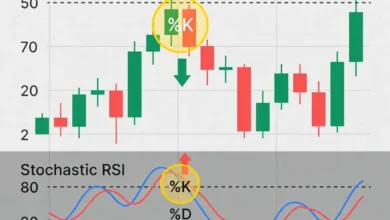
The %K and %D Lines Explained
The stochastic oscillator consists of two lines:
- %K Line – The primary line that measures momentum.
- %D Line – A moving average of the %K line that acts as a signal line.
The interaction between the %K line and %D line generates many of the trading signals used by traders.
Stochastic Formula and Calculation
The basic stochastic formula is:
%K = ((Current Close – Lowest Low) / (Highest High – Lowest Low)) × 100
Where:
- Lowest Low = Lowest price during the selected period
- Highest High = Highest price during the selected period
- Current Close = Latest closing price
The %D line is usually calculated as a 3-period moving average of the %K line.
Overbought and Oversold Zones
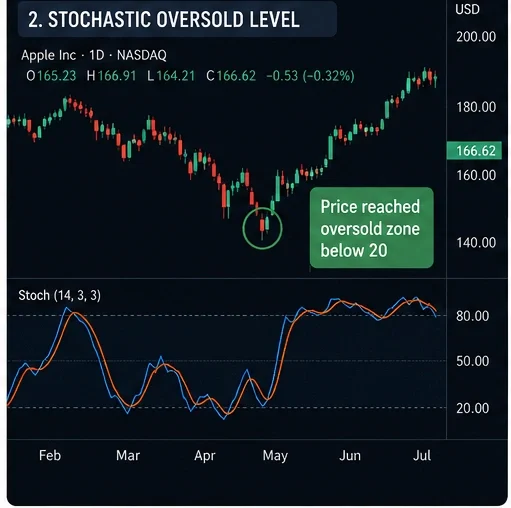
One of the biggest advantages of the stochastic oscillator is its ability to identify overbought oversold levels.
The indicator helps traders determine when momentum may be reaching an extreme.
What Do the 80 and 20 Levels Mean?
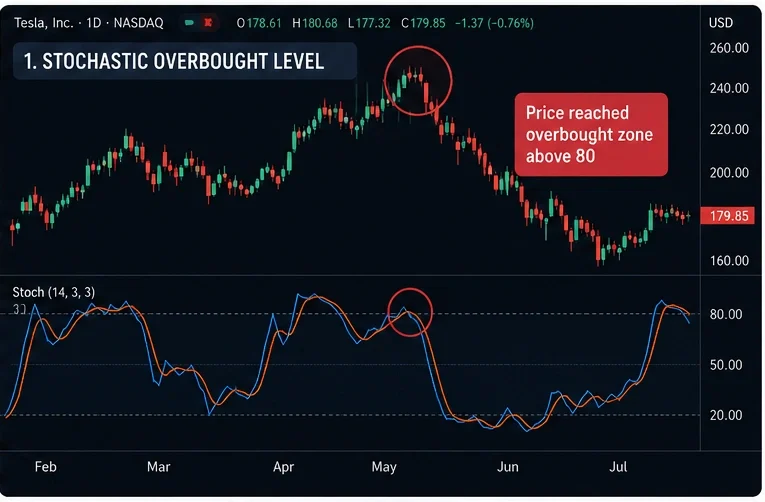
The most commonly used 80 20 stochastic levels are:
- Above 80 = Overbought market
- Below 20 = Oversold market
A reading above 80 does not necessarily mean price will immediately fall. Similarly, a reading below 20 does not guarantee a rally.
Instead, these levels suggest that momentum may be stretched and traders should look for additional confirmation before entering a position.
An oversold bounce often occurs when the indicator rises back above 20 after spending time in oversold territory.
Fast Stochastic vs Slow Stochastic
There are two main versions of the indicator:
Which One Should You Use and When?
Fast Stochastic
- More responsive to price changes
- Generates earlier signals
- Produces more false signals
- Popular among short-term traders and scalping stochastic strategies
Slow Stochastic
- Uses additional smoothing
- Generates fewer signals
- More reliable in trending markets
- Preferred by swing traders
When comparing fast stochastic vs slow stochastic, the best choice depends on your trading style and risk tolerance.
Stochastic Trading Signals
The oscillator provides several useful trading opportunities.
How to Read a Crossover Signal
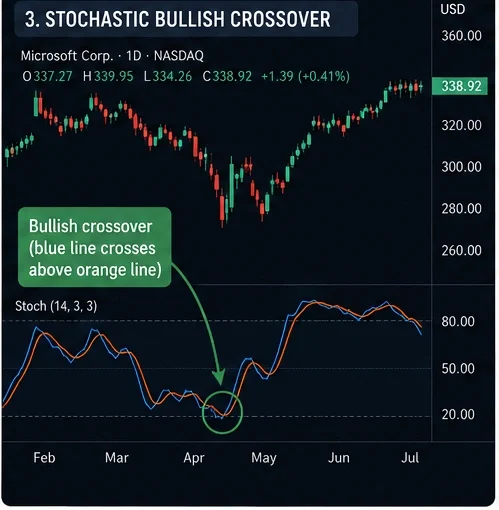
A stochastic crossover signal occurs when the %K line crosses the %D line.
Bullish Crossover
- %K crosses above %D
- Often considered a stochastic buy sell signal
- Stronger when occurring below 20
Bearish Crossover
- %K crosses below %D
- May signal weakening momentum
- Stronger when occurring above 80
Many traders use crossover signals alongside support and resistance levels for additional confirmation.
Divergence Strategy with Stochastic
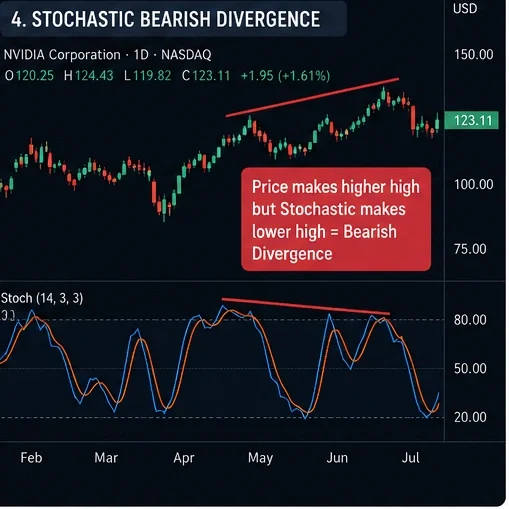
Stochastic divergence occurs when price and momentum move in opposite directions.
Examples include:
- Price makes a lower low while stochastic makes a higher low (bullish divergence)
- Price makes a higher high while stochastic makes a lower high (bearish divergence)
Divergence is often considered a powerful trend reversal signal because it may indicate weakening momentum before price reverses.
Best Settings for Stochastic Oscillator
The default stochastic settings are:
14, 3, 3
These settings work well for most markets and timeframes.
However, traders may adjust them depending on their strategy:
- 5,3,3 for faster signals
- 14,3,3 for balanced analysis
- 21,5,5 for longer-term trend identification
For stochastic indicator forex trading, the default settings remain a common choice. The same applies to many stochastic indicator crypto strategies where momentum shifts occur frequently.
Stochastic Limitations and False Signals
Although effective, the stochastic oscillator is not perfect.
Common limitations include:
- Frequent false signals during strong trends
- Overbought readings can remain elevated for extended periods
- Oversold readings can persist during downtrends
- Crossover signals may occur too early
Because of these limitations, traders rarely rely on the indicator alone.
Combining stochastic analysis with trend structure, volume, and support-resistance levels often improves accuracy.
Using Stochastic with RSI Together
A popular approach is comparing stochastic vs RSI and using both indicators simultaneously.
While both measure momentum, they do so differently:
| Stochastic Oscillator | RSI |
|---|---|
| Compares close to price range | Measures average gains and losses |
| More sensitive | Less sensitive |
| Produces more signals | Produces fewer signals |
Using both indicators together can reduce false entries and provide stronger confirmation for potential trades.
For example:
- Stochastic signals oversold conditions
- RSI confirms momentum recovery
- Price breaks resistance
This combination often produces higher-quality trade setups.
Frequently Asked Questions
Is the stochastic oscillator good for beginners?
Yes. Its visual simplicity makes it one of the easiest momentum indicators to learn and apply.
What is the best timeframe for stochastic trading?
The indicator can be used on any timeframe. Day traders often use 5-minute and 15-minute charts, while swing traders prefer 4-hour and daily charts.
Can stochastic be used in crypto trading?
Yes. The stochastic indicator crypto traders use works the same way as in stocks and forex markets.
Is stochastic better than RSI?
Neither indicator is universally better. Many traders combine stochastic and RSI to gain stronger confirmation.
What is the most reliable stochastic signal?
Many traders consider bullish or bearish divergence combined with a crossover signal to be among the most reliable setups.