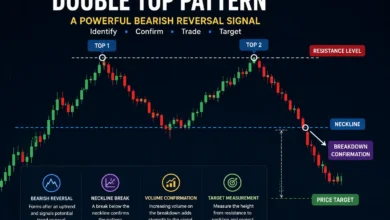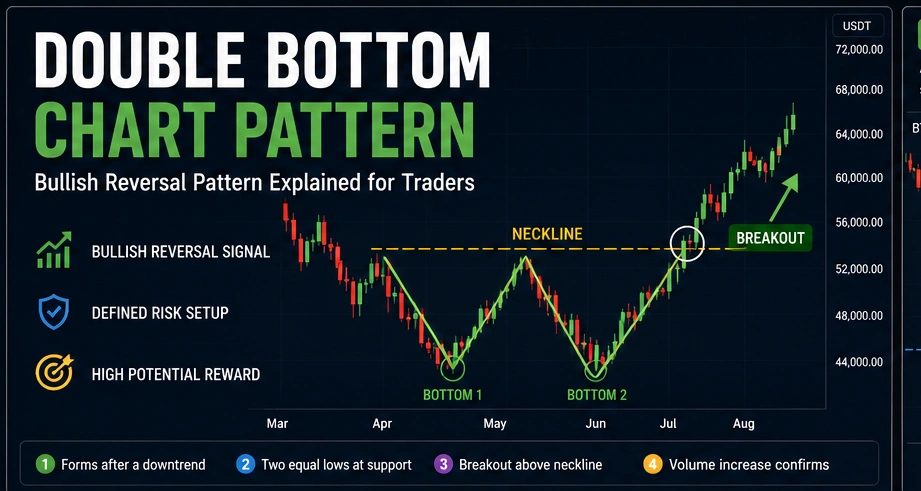
The double bottom chart pattern is one of the most popular bullish reversal formations used in technical analysis. Traders rely on it to identify potential trend changes after a prolonged decline. When it appears in the right market conditions, it can provide early clues that sellers are losing control and buyers are beginning to step in.
Often referred to as a W-shaped pattern, the setup forms when price tests the same support level twice before moving higher. This structure makes it easier for traders to identify potential entry opportunities with clearly defined risk levels.
Understanding how the pattern develops, how to confirm it, and how to manage the trade properly can significantly improve decision-making.
What Is a Double Bottom Chart Pattern?
The double bottom pattern is a bullish reversal pattern that forms after a downtrend. It consists of two distinct lows that occur near the same support area, separated by a temporary recovery.
The pattern reflects a shift in market psychology. During the first decline, sellers dominate the market. After a bounce, sellers attempt another push lower but fail to create a meaningful new low. This inability to continue the downtrend often signals weakening bearish momentum.
Once buyers gain enough strength to push price above resistance, the reversal becomes more convincing.
How a Double Bottom Formation Develops
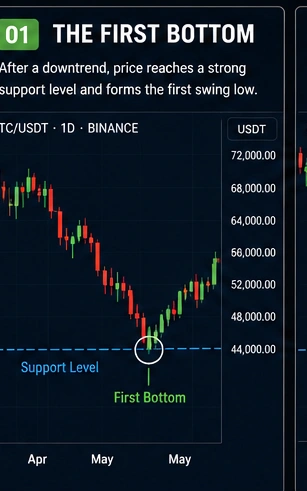
The First Swing Low
The pattern begins after a clear downtrend. Price falls aggressively and reaches a significant support level where buyers start to emerge.
This creates the first swing low and triggers a short-term recovery. At this stage, the broader market trend is still bearish.
The Neckline Forms
As buyers enter the market, price moves higher and creates a temporary resistance area. This resistance becomes the neckline of the pattern.
The neckline serves as the most important level in the formation because traders use it to confirm a potential reversal.
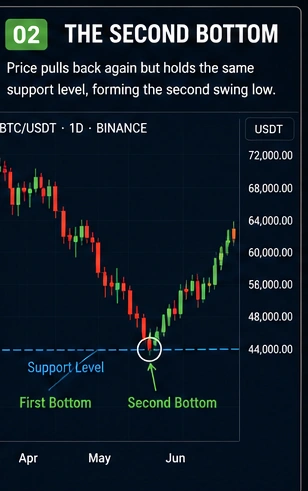
The Second Swing Low
After reaching resistance, price pulls back toward support once again. Instead of making a substantially lower low, the market finds buyers near the same level.
This second rejection creates the bottom portion of the W-shaped structure. In many cases, selling pressure is weaker during the second decline, indicating that bearish momentum is fading.
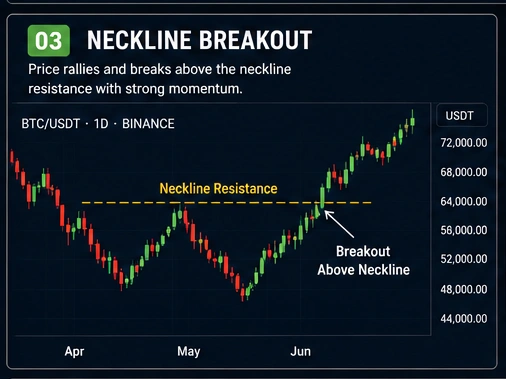
Neckline Breakout Confirmation
The double bottom formation is not complete until price breaks above the neckline. This move is known as a neckline breakout or breakout confirmation.
Without confirmation, the pattern remains only a possibility. Many failed setups occur because traders enter too early before resistance is broken.
Why the Double Bottom Pattern Is Considered Bullish
The strength of the pattern comes from market psychology. Sellers successfully pushed prices lower during the first decline but could not maintain control during the second test of support.
This failure often attracts buyers who recognize the developing reversal. At the same time, short sellers may begin closing positions, adding further buying pressure.
As demand increases, the market gains bullish momentum. The neckline breakout frequently acts as the trigger that confirms a new upward trend may be underway.
How to Trade a Double Bottom Pattern
Entry Strategy
Most traders wait for a confirmed breakout above the neckline before entering a position. This approach reduces the risk of entering a false reversal.
Some traders enter immediately after the breakout. Others prefer to wait for a retest of the neckline as new support before committing capital.
Stop Loss Placement
Proper stop loss placement is essential when trading any price action pattern.
A common approach is placing the stop below the second bottom. This level represents the area where the bullish setup becomes invalid.
Traders seeking tighter risk management may use a closer stop, but this increases the likelihood of being stopped out by normal market fluctuations.
Price Target Calculation
The traditional price target calculation method is simple.
Measure the distance between the neckline and the lowest point of the pattern. Then add that distance above the breakout level.
For example, if the neckline is located at $100 and the bottom forms at $85, the pattern height equals $15. A breakout above $100 would create a projected target near $115.
While useful, price targets should always be combined with market structure and resistance analysis.
The Role of Volume in Confirmation
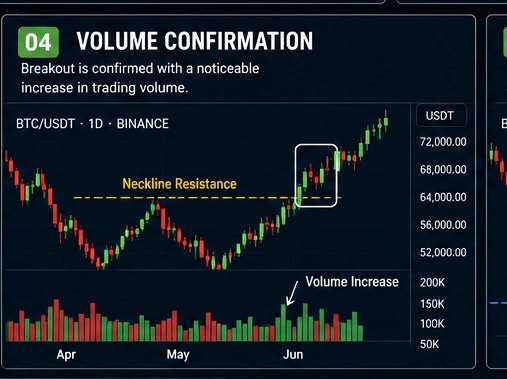
Volume often plays a significant role in chart pattern trading.
A healthy double bottom frequently shows reduced selling pressure during the second decline. When the breakout occurs, traders typically look for a noticeable volume increase.
Rising volume suggests stronger participation from buyers and may improve the reliability of the signal. Weak volume, on the other hand, can increase the risk of a failed breakout.
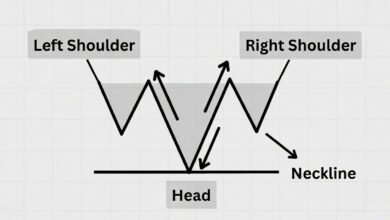
Double Bottom vs Inverse Head and Shoulders
The inverse head and shoulders pattern shares several similarities with the double bottom. Both are considered technical analysis patterns that signal potential bullish reversals.
The main difference lies in structure. A double bottom contains two lows at similar levels, while an inverse head and shoulders pattern contains three lows, with the middle low forming the deepest point.
Both patterns rely on breakout confirmation and are commonly used to identify trend reversals.
Additional Confirmation Signals
Experienced traders rarely rely on a single pattern.
Additional confirmation may include:
- Bullish candlestick confirmation near support
- Strong support and resistance structure
- İncreasing trading volume
- Momentum indicator strength
- Clear entry and exit signals
- Favorable market conditions
Combining multiple factors can improve confidence and reduce false signals.
Common Mistakes Traders Make
One of the most common mistakes is entering before the neckline breakout occurs. Without confirmation, the market may continue moving lower.
Another mistake is ignoring the broader trend. Even strong reversal patterns can fail in highly volatile market environments.
Poor risk management is also a frequent issue. Every trade should include a predefined stop loss and realistic profit target.
Frequently Asked Questions About the Double Bottom Pattern
How reliable is a double bottom pattern?
The pattern can be highly reliable when supported by strong breakout confirmation, volume expansion, and favorable market conditions.
Is a double bottom always bullish?
It is considered a bullish reversal signal, but no chart pattern guarantees success.
What timeframe works best?
The pattern can appear on any timeframe. Daily and weekly charts generally provide stronger signals than shorter-term charts.
Is volume important?
Yes. A noticeable volume increase during the breakout often strengthens the validity of the pattern.