Double Top Pattern: Complete Guide to This Bearish Reversal Signal
What Is a Double Top Pattern?
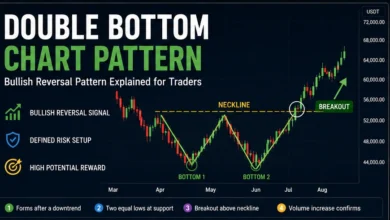
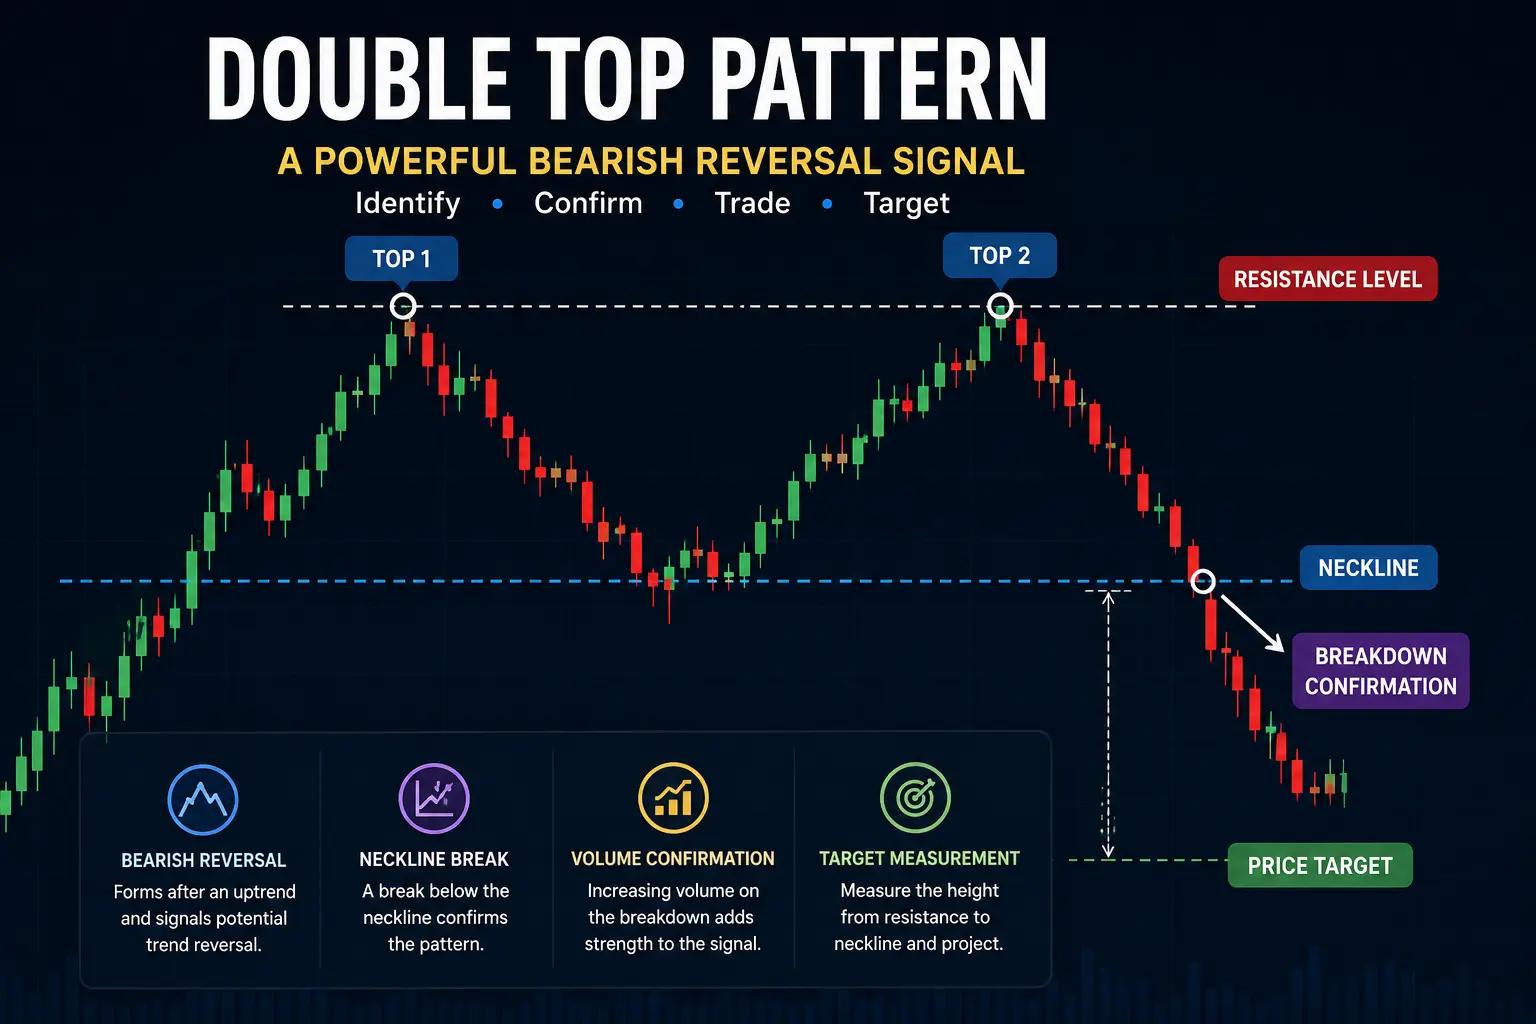
A double top pattern is a bearish reversal pattern that usually forms after a clear upward trend. The price reaches a high, pulls back, then rises again to test a similar high. When the second attempt fails, it suggests the market may no longer have enough buying momentum.
The two peaks are called swing highs. The low between them creates the neckline, which acts as a temporary support level. The pattern is not fully confirmed until the price breaks below this neckline.
How the Double Top Formation Works
The structure of the double top in technical analysis is easy to understand when broken into stages
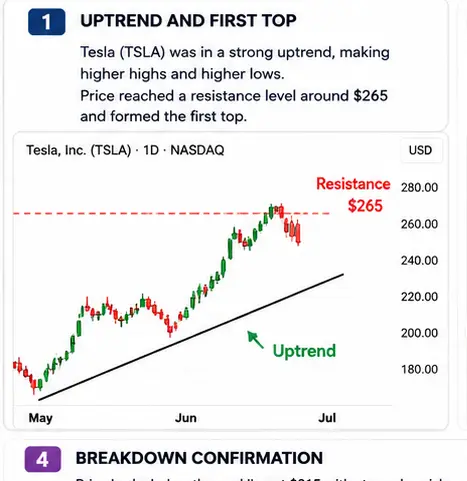
Uptrend: Price makes higher highs and higher lows.
First top: Buyers push price into a resistance level.
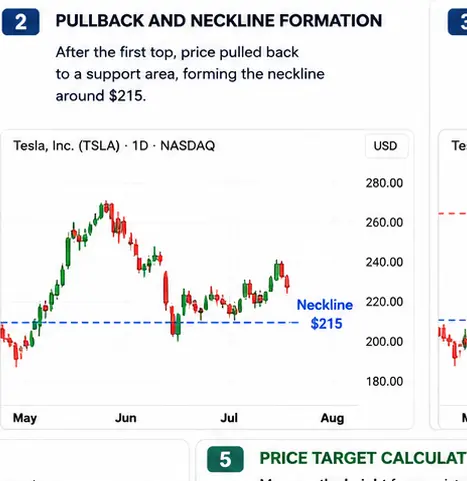
Pullback: Price drops and forms the neckline.Second top: Price retests the same resistance but fails.
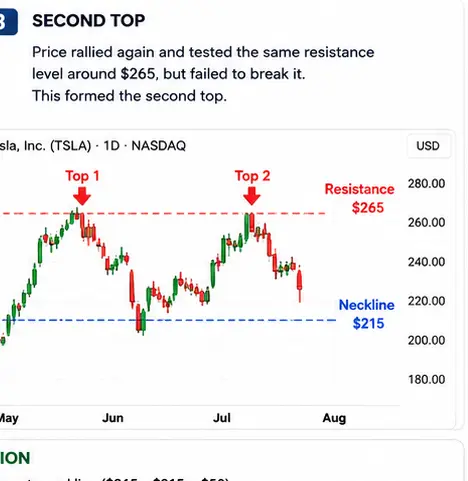
Second top: Price retests the same resistance but fails.
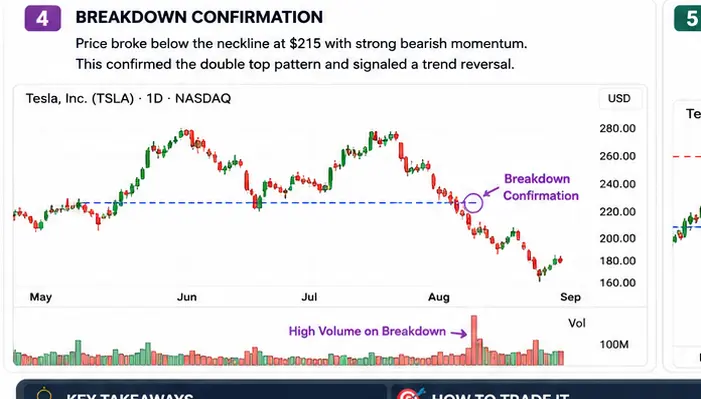
Neckline breakout: Price breaks below support, confirming weakness.
This final move is often called breakdown confirmation. A strong breakdown with rising volume is generally viewed as more reliable because it shows stronger selling participation. Investopedia notes that breakouts or breakdowns with higher volume tend to show greater conviction.
Why the Double Top Is a Trend Reversal Signal
The psychology behind the double top chart pattern is important. At the first top, sellers appear near resistance and stop the advance. When the price returns to the same level, buyers expect a breakout, but sellers defend the zone again.
This second failure can damage buyer confidence. Traders who bought near the second peak may exit quickly if the price falls. Short sellers may also enter after the neckline breaks.
That is why the pattern is often treated as a trend reversal signal. It does not guarantee a downtrend, but it warns that the previous bullish trend may be weakening.
How to Trade a Double Top Pattern
A careful trader does not enter only because two peaks appear. The smarter approach is to wait for confirmation.
The most common entry is after the price closes below the neckline. Some traders enter immediately after the breakdown. Others wait for a retest of the neckline, which may turn from support into resistance.
For stop loss placement, many traders place the stop above the second top. This protects the trade if the pattern fails and price breaks higher. A tighter stop may reduce risk, but it can also increase the chance of being stopped out early.
Price Target Calculation
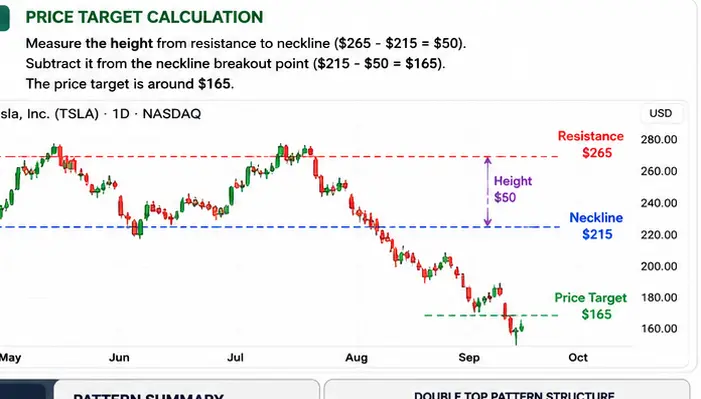
The classic price target calculation is based on the height of the pattern. Measure the distance between the resistance level and the neckline. Then subtract that same distance from the neckline breakdown point.
For example, imagine the tops form near $100 and the neckline is at $90. The pattern height is $10. If price breaks below $90, the estimated target becomes $80.
This method is useful, but it should not be treated as a promise. Market conditions, news, liquidity, and broader trend direction can all affect the final move.
Volume Divergence and Confirmation
Volume divergence can make the signal stronger. Ideally, the second top forms with lower volume than the first top. This suggests buyers are less aggressive during the second attempt.
Then, when the neckline breaks, traders often look for increased volume. Strong selling volume can support the idea that the breakdown is real. Weak volume may warn of a false breakdown or sideways movement.
Common Mistakes to Avoid
The biggest mistake is entering too early. A double top is only a potential setup before the neckline breaks. Without confirmation, the price can still break above resistance and continue the uptrend.
Another mistake is ignoring the broader market. A bearish setup may fail if the overall market is strongly bullish. Traders should also avoid placing stops too close to the entry without considering normal price volatility.
Finally, never risk too much on one chart pattern trading setup. A double top is a useful price action pattern, but no pattern works every time.
Quick Checklist
Use this simple checklist before trading:
- Clear uptrend before the pattern
- Two similar swing highs
- Strong resistance level
- Visible neckline
- Breakdown below neckline
- Rising volume on breakdown
- Logical stop loss placement
- Realistic price target calculation
FAQ: Double Top Pattern
Is the double top pattern always bearish?
Yes, it is generally considered bearish. However, it only becomes more reliable after a confirmed neckline breakdown.
Can a double top formation fail?
Yes. If price breaks above the second top instead of falling below the neckline, the pattern is invalid.
Which timeframe works best?
The pattern can appear on any timeframe, but higher timeframes such as 4-hour, daily, and weekly charts often carry more weight.
Is volume necessary for confirmation?
Volume is not mandatory, but it helps. Strong volume on the breakdown can make the signal more convincing.