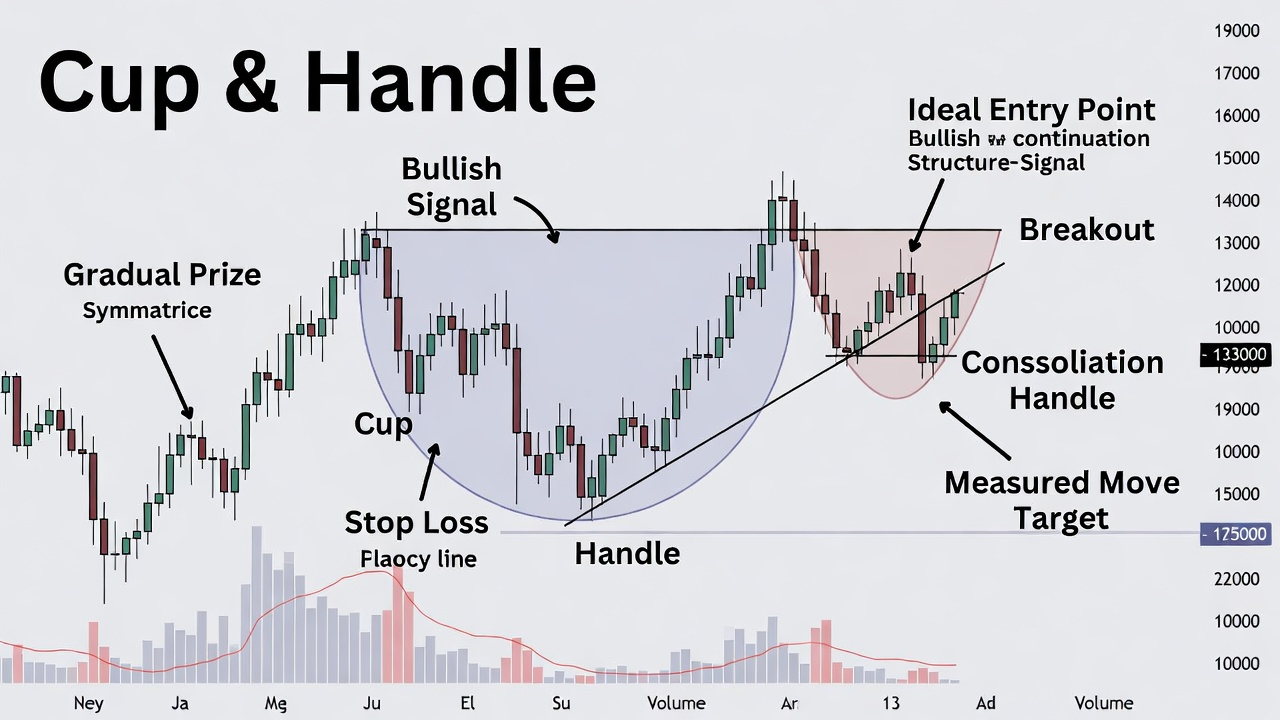
The cup and handle pattern is one of the most reliable bullish continuation setups in technical analysis. Traders watch for this formation because it frequently signals the resumption of a strong uptrend after a period of consolidation. Popularized by William O’Neil, the pattern visually resembles a teacup with a rounded bottom (the cup) followed by a short handle on the right side.
Formation of the Cup
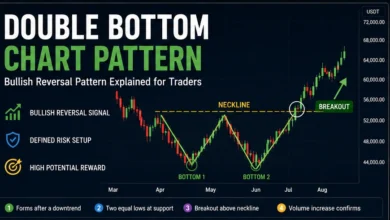
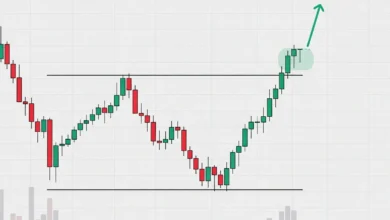
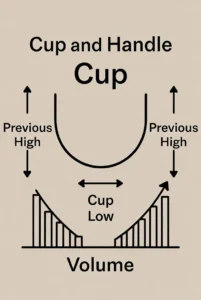
The cup begins after an established uptrend when prices gradually decline and recover in a smooth U-shape. This rounding bottom typically lasts several weeks to months. Volume usually drops during the decline and slowly increases as the price bottoms out and starts climbing back toward the previous high.
The right side of the cup rises gradually. For the pattern to remain valid, the cup depth should ideally stay between 12% and 33%. A clean, bowl-like curve is essential — sharp V-bottoms do not qualify as they lack proper basing.
The Handle Phase
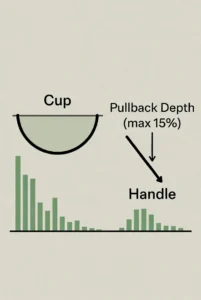
Once the cup is complete, the handle forms as a short consolidation or mild pullback. This phase usually lasts one to four weeks and retraces no more than 10-15% of the cup’s height. Declining volume during the handle is a positive sign, reflecting a final shakeout of weaker participants.
The handle should sit in the upper portion of the pattern and form near the resistance level set by the left side of the cup. This tightening price action creates the tension needed for a powerful breakout.
Breakout Confirmation and Target
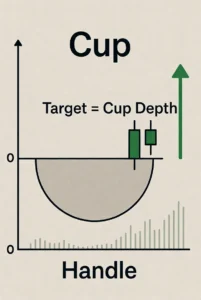
The pattern activates when price breaks clearly above the resistance line connecting the cup and handle highs. This breakout gains credibility only when accompanied by a noticeable increase in trading volume.
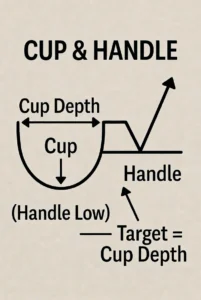
Traders calculate the price target by measuring the full depth of the cup and adding that distance to the breakout point. If the cup depth is $18 and the breakout occurs at $52, the projected target reaches approximately $70.
Risk Management Rules
Before entering a trade, place a stop-loss just below the handle low or slightly under the cup bottom. Position size should limit risk to 1-2% of total capital. Once the price moves favorably, trailing stops help protect accumulated gains while allowing the trend to continue.
Common Mistakes to Avoid
Many traders accept sharp V-bottoms or excessively deep cups as valid patterns. Handles that are too long or drift too far also reduce reliability. Entering before the volume-confirmed breakout frequently leads to false signals. The pattern performs best in overall bullish or neutral market conditions.
The cup and handle reflects natural market psychology: the rounded cup shows gradual seller exhaustion and quiet accumulation, while the handle represents the final test before renewed buying momentum takes over.
By mastering the structure, waiting for proper confirmation, and applying sound risk management, traders can use this classic formation to capture significant bullish moves across stocks, cryptocurrencies, and other markets.