The Head and Shoulders pattern is one of the most reliable and widely used reversal patterns in technical analysis. Traders use this pattern to identify potential trend reversals, especially at the end of an uptrend. Understanding how the Head and Shoulders pattern works can help traders identify market turning points, manage risk, and improve trade timing.
The Head and Shoulders pattern is considered a bearish reversal pattern, meaning it usually signals that an uptrend is about to end and a downtrend may begin. There is also an opposite version called the Inverse Head and Shoulders, which signals a bullish reversal.
What Is the Head and Shoulders Pattern?
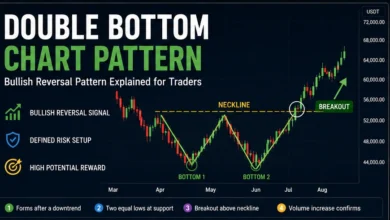
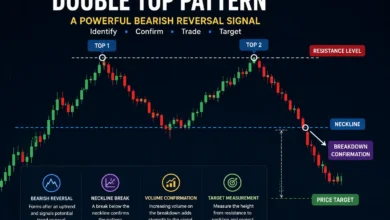
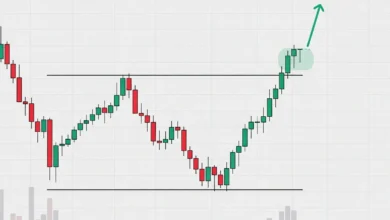
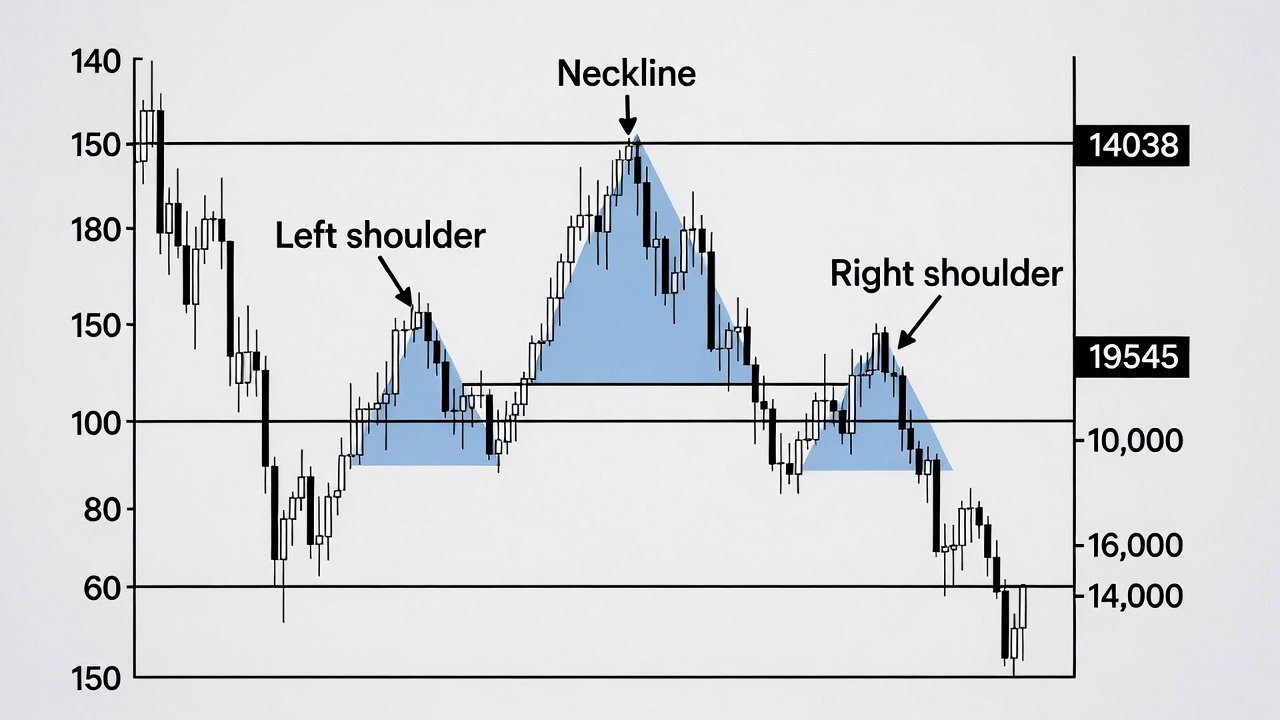
The Head and Shoulders pattern is a chart formation that consists of three peaks. The middle peak is the highest point and is called the “head,” while the two peaks on the sides are lower and are called the “shoulders.” The pattern also includes a support level called the “neckline,” which plays a critical role in confirming the pattern.
The structure of the pattern shows that buyers are losing strength. The market first makes a high (left shoulder), then makes a higher high (head), and finally makes a lower high (right shoulder). This indicates that the trend is weakening and sellers are starting to take control.
Structure of the Pattern
The Head and Shoulders pattern consists of five main parts:
- Left Shoulder
- Head
- Right Shoulder
- Neckline
- Breakout
The left shoulder forms after a strong uptrend and represents the first sign of weakness. The head forms when the price makes a new high but then falls again. The right shoulder forms when the price rises again but fails to reach the previous high. Finally, the pattern is confirmed when the price breaks below the neckline.
Psychology Behind the Pattern
Understanding the psychology behind the pattern is very important because technical analysis is largely based on market psychology.
During the left shoulder, buyers are still in control and the uptrend continues. When the head forms, buyers push the price higher again, but the sell-off after the head is stronger than before. This is the first warning sign. When the right shoulder forms, buyers try to push the price higher again, but they fail to make a new high. This shows that buying pressure is weakening. When the neckline breaks, sellers take control and the trend reverses.
In simple terms, the pattern shows the transition from buyer control to seller control.
How to Identify the Head and Shoulders Pattern
To correctly identify the pattern, traders should look for the following conditions:
The market should be in a clear uptrend before the pattern forms. The left shoulder should form with a peak followed by a pullback. The head should be a higher peak than the left shoulder. The right shoulder should be lower than the head and usually similar height to the left shoulder. The neckline should connect the two pullback lows. Finally, the pattern is confirmed only when the price breaks the neckline.
One important mistake beginners make is trading the pattern before the neckline breaks. The pattern is not confirmed until the neckline is broken.
Neckline and Breakout
The neckline is the most important level in the Head and Shoulders pattern. It acts as a support level, and when the price breaks below it, the pattern becomes valid.
Sometimes the price comes back to retest the neckline after the breakout. This is called a pullback or retest, and many traders use this as an entry point.
How to Trade the Head and Shoulders Pattern
Trading this pattern involves three main steps: entry, stop loss, and take profit.
Entry:
The most common entry point is when the price breaks below the neckline. More conservative traders wait for a retest of the neckline.
Stop Loss:
The stop loss is usually placed above the right shoulder. This protects the trader in case the pattern fails.
Take Profit:
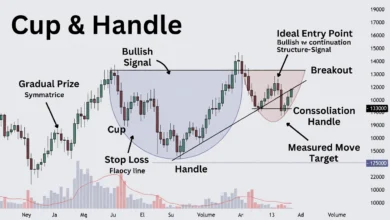
The take profit is calculated by measuring the distance from the head to the neckline and projecting that distance downward from the breakout point.
This is known as the measured move technique.
Inverse Head and Shoulders Pattern
The Inverse Head and Shoulders pattern is the opposite version of the pattern and signals a bullish reversal. It forms after a downtrend and indicates that the market may start moving upward. The structure is the same, but flipped upside down. Instead of breaking below the neckline, the price breaks above the neckline.
Common Mistakes Traders Make
Many traders make mistakes when trading this pattern. The most common mistakes include entering before the neckline break, ignoring volume, and trading the pattern in a sideways market.
Volume is important because volume usually decreases during the formation of the pattern and increases during the breakout. If there is no volume increase during the breakout, the pattern may fail.
Another common mistake is forcing the pattern. Not every three-peak structure is a Head and Shoulders pattern. The pattern should form clearly and in a trending market.
Why the Head and Shoulders Pattern Is Important
The Head and Shoulders pattern is important because it helps traders identify trend reversals, understand market psychology, and find high-probability trade setups. It is one of the most popular chart patterns used by professional traders, and it appears in all markets including stocks, forex, and cryptocurrency.
When used correctly with support and resistance, trend lines, and volume analysis, the Head and Shoulders pattern can be a very powerful trading tool.
The Head and Shoulders pattern is a classic trend reversal pattern that signals the end of an uptrend and the potential start of a downtrend. The pattern consists of the left shoulder, head, right shoulder, and neckline. The most important confirmation signal is the neckline breakout. Traders typically enter after the breakout, place a stop loss above the right shoulder, and calculate the take profit using the measured move method.
Learning to correctly identify and trade the Head and Shoulders pattern can significantly improve a trader’s ability to spot market reversals and make better trading decisions.