What Is Average True Range and How Do Traders Use It
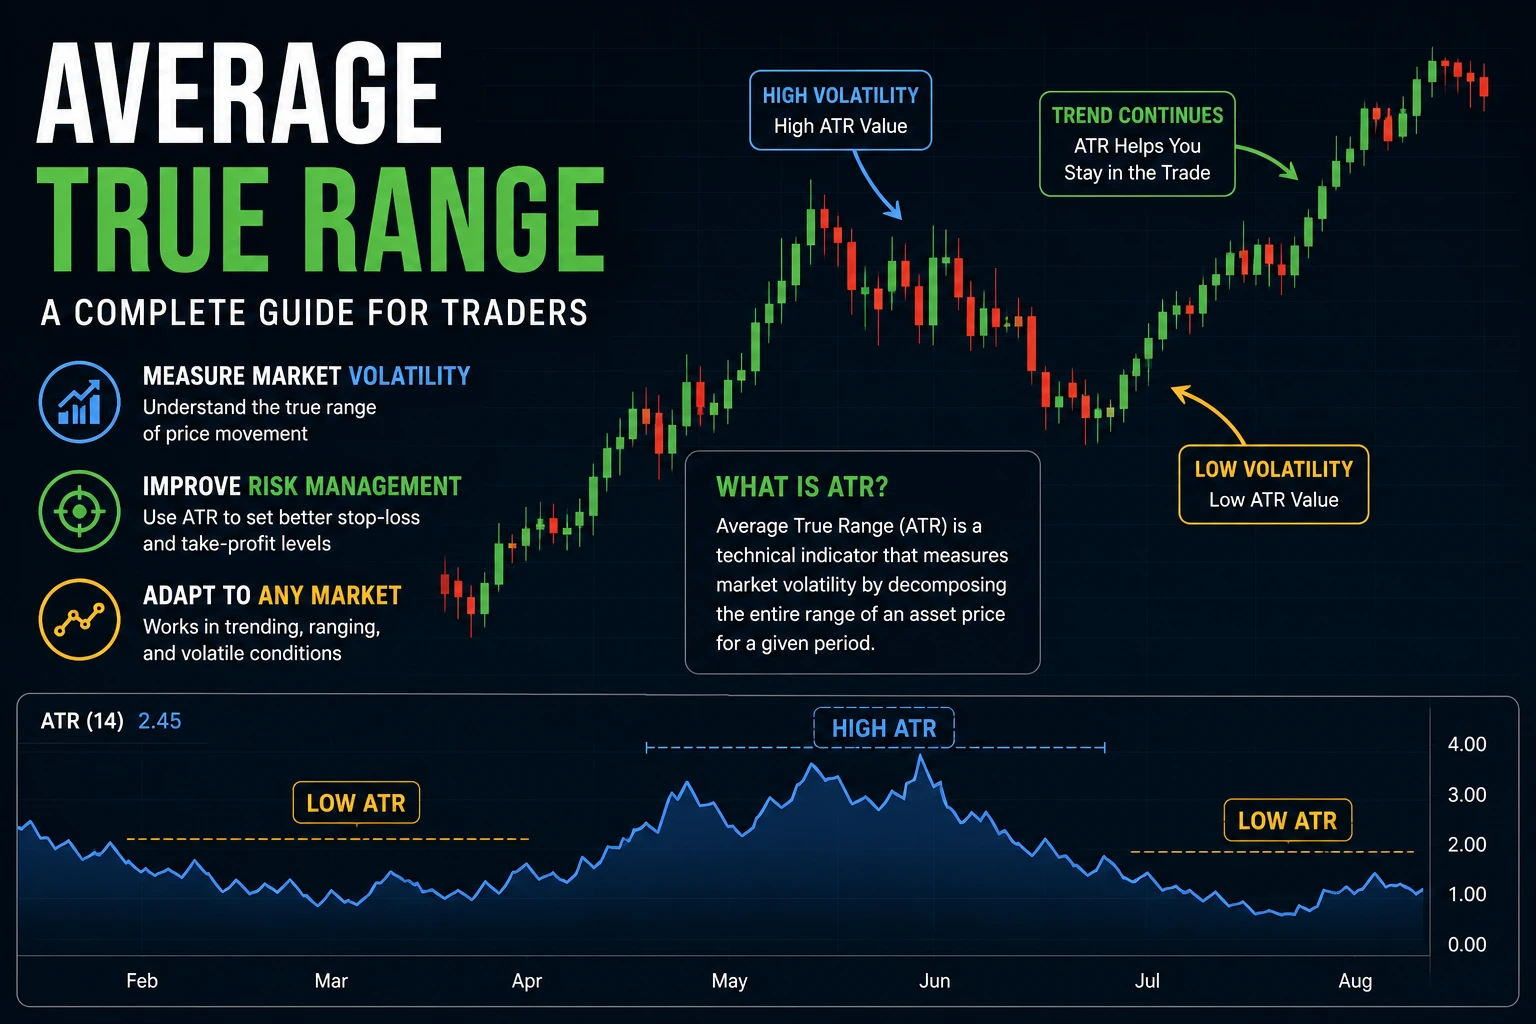
Average True Range Explained: How Traders Use ATR to Manage Volatility
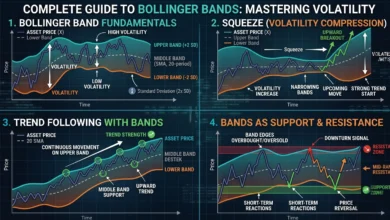
Volatility is the heartbeat of every market. Without understanding how much a price typically moves, setting a stop-loss becomes guesswork and sizing a position becomes a gamble. Average True Range — commonly written as ATR — gives traders a structured, data-driven way to quantify that movement and make more deliberate decisions.
What ATR Actually Measures
Developed by J. Welles Wilder and introduced in his 1978 book New Concepts in Technical Trading Systems, ATR is not a directional indicator. It tells you nothing about whether price will go up or down. Instead, it measures the degree of price movement over a given period — typically 14 bars — by averaging the “true range” of each candle.
The true range of any single candle is the largest of three values: the distance from the current high to the current low, from the previous close to the current high, or from the previous close to the current low. This three-part calculation ensures that overnight gaps and sudden opens are captured, not ignored. A plain high-low range would miss those entirely.
How the Calculation Works in Practice
To put this concretely: if a stock closes at $50, then opens the next day at $53 and trades to a high of $55 before pulling back to $51, the true range is $5 — measured from yesterday’s close of $50 to today’s high of $55, not just the intraday high-low spread of $4. Wilder then smoothed these values using a rolling average, producing a single number that reflects the asset’s typical daily swing.
A 14-period ATR on a daily chart reflects average volatility across the past two trading weeks. A higher ATR means the asset is moving more aggressively; a lower ATR signals a quieter, tighter market. Neither is inherently better — context determines which environment suits a given strategy.
Setting Stop-Losses With Volatility in Mind
One of the most practical uses of ATR is stop-loss placement. A fixed-dollar stop ignores the fact that a $0.50 move is significant for one stock and irrelevant noise for another. ATR-based stops adapt to the instrument and the current environment.
A common approach is to place a stop 1.5× to 2× ATR from the entry point. If a stock’s 14-day ATR is $2.00 and you enter at $40, a 2× ATR stop sits at $36 — far enough to absorb normal fluctuation without being so tight that routine volatility triggers an exit. This method reduces the frequency of being stopped out on noise while still defining clear risk.
Position Sizing and Risk Management
ATR also feeds directly into position sizing. If your maximum acceptable loss on a trade is $500 and the ATR-based stop distance is $2.50 per share, the math tells you to buy 200 shares — no more. This approach ties every position to actual market behavior rather than arbitrary share counts or round-number lot sizes.
Traders using this method find that position sizes naturally shrink during high-volatility periods and expand when markets are calm. That built-in adjustment keeps the dollar risk consistent even as market conditions shift, which is central to preserving capital over time.
Reading ATR as a Market Context Signal
Beyond individual trade management, ATR reveals the broader state of the market. A sustained contraction in ATR — where the indicator trends lower over several weeks — often precedes a sharp directional move, as compressed volatility tends to resolve with expansion. Traders who recognize this pattern can prepare for a breakout without predicting its direction.
Conversely, extreme ATR spikes frequently appear near market exhaustion points, where panic or euphoria drives outsized moves that are difficult to sustain. Rather than chasing those moves, experienced traders use elevated ATR readings as a reason to reduce size or tighten criteria. ATR, used this way, becomes less of an entry trigger and more of a risk filter — one that keeps position sizing and expectations grounded in what the market is actually doing.