Bollinger Bands
Bollinger Bands are one of the most widely used technical indicators in financial markets, yet they’re frequently misread. Developed by John Bollinger in the 1980s, the tool wraps price action inside a dynamic channel that expands and contracts based on market volatility. Understanding what that channel is actually telling you — and what it isn’t — separates traders who use it effectively from those who don’t.
How the Indicator Is Constructed
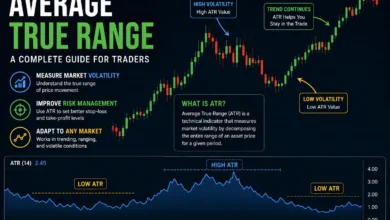
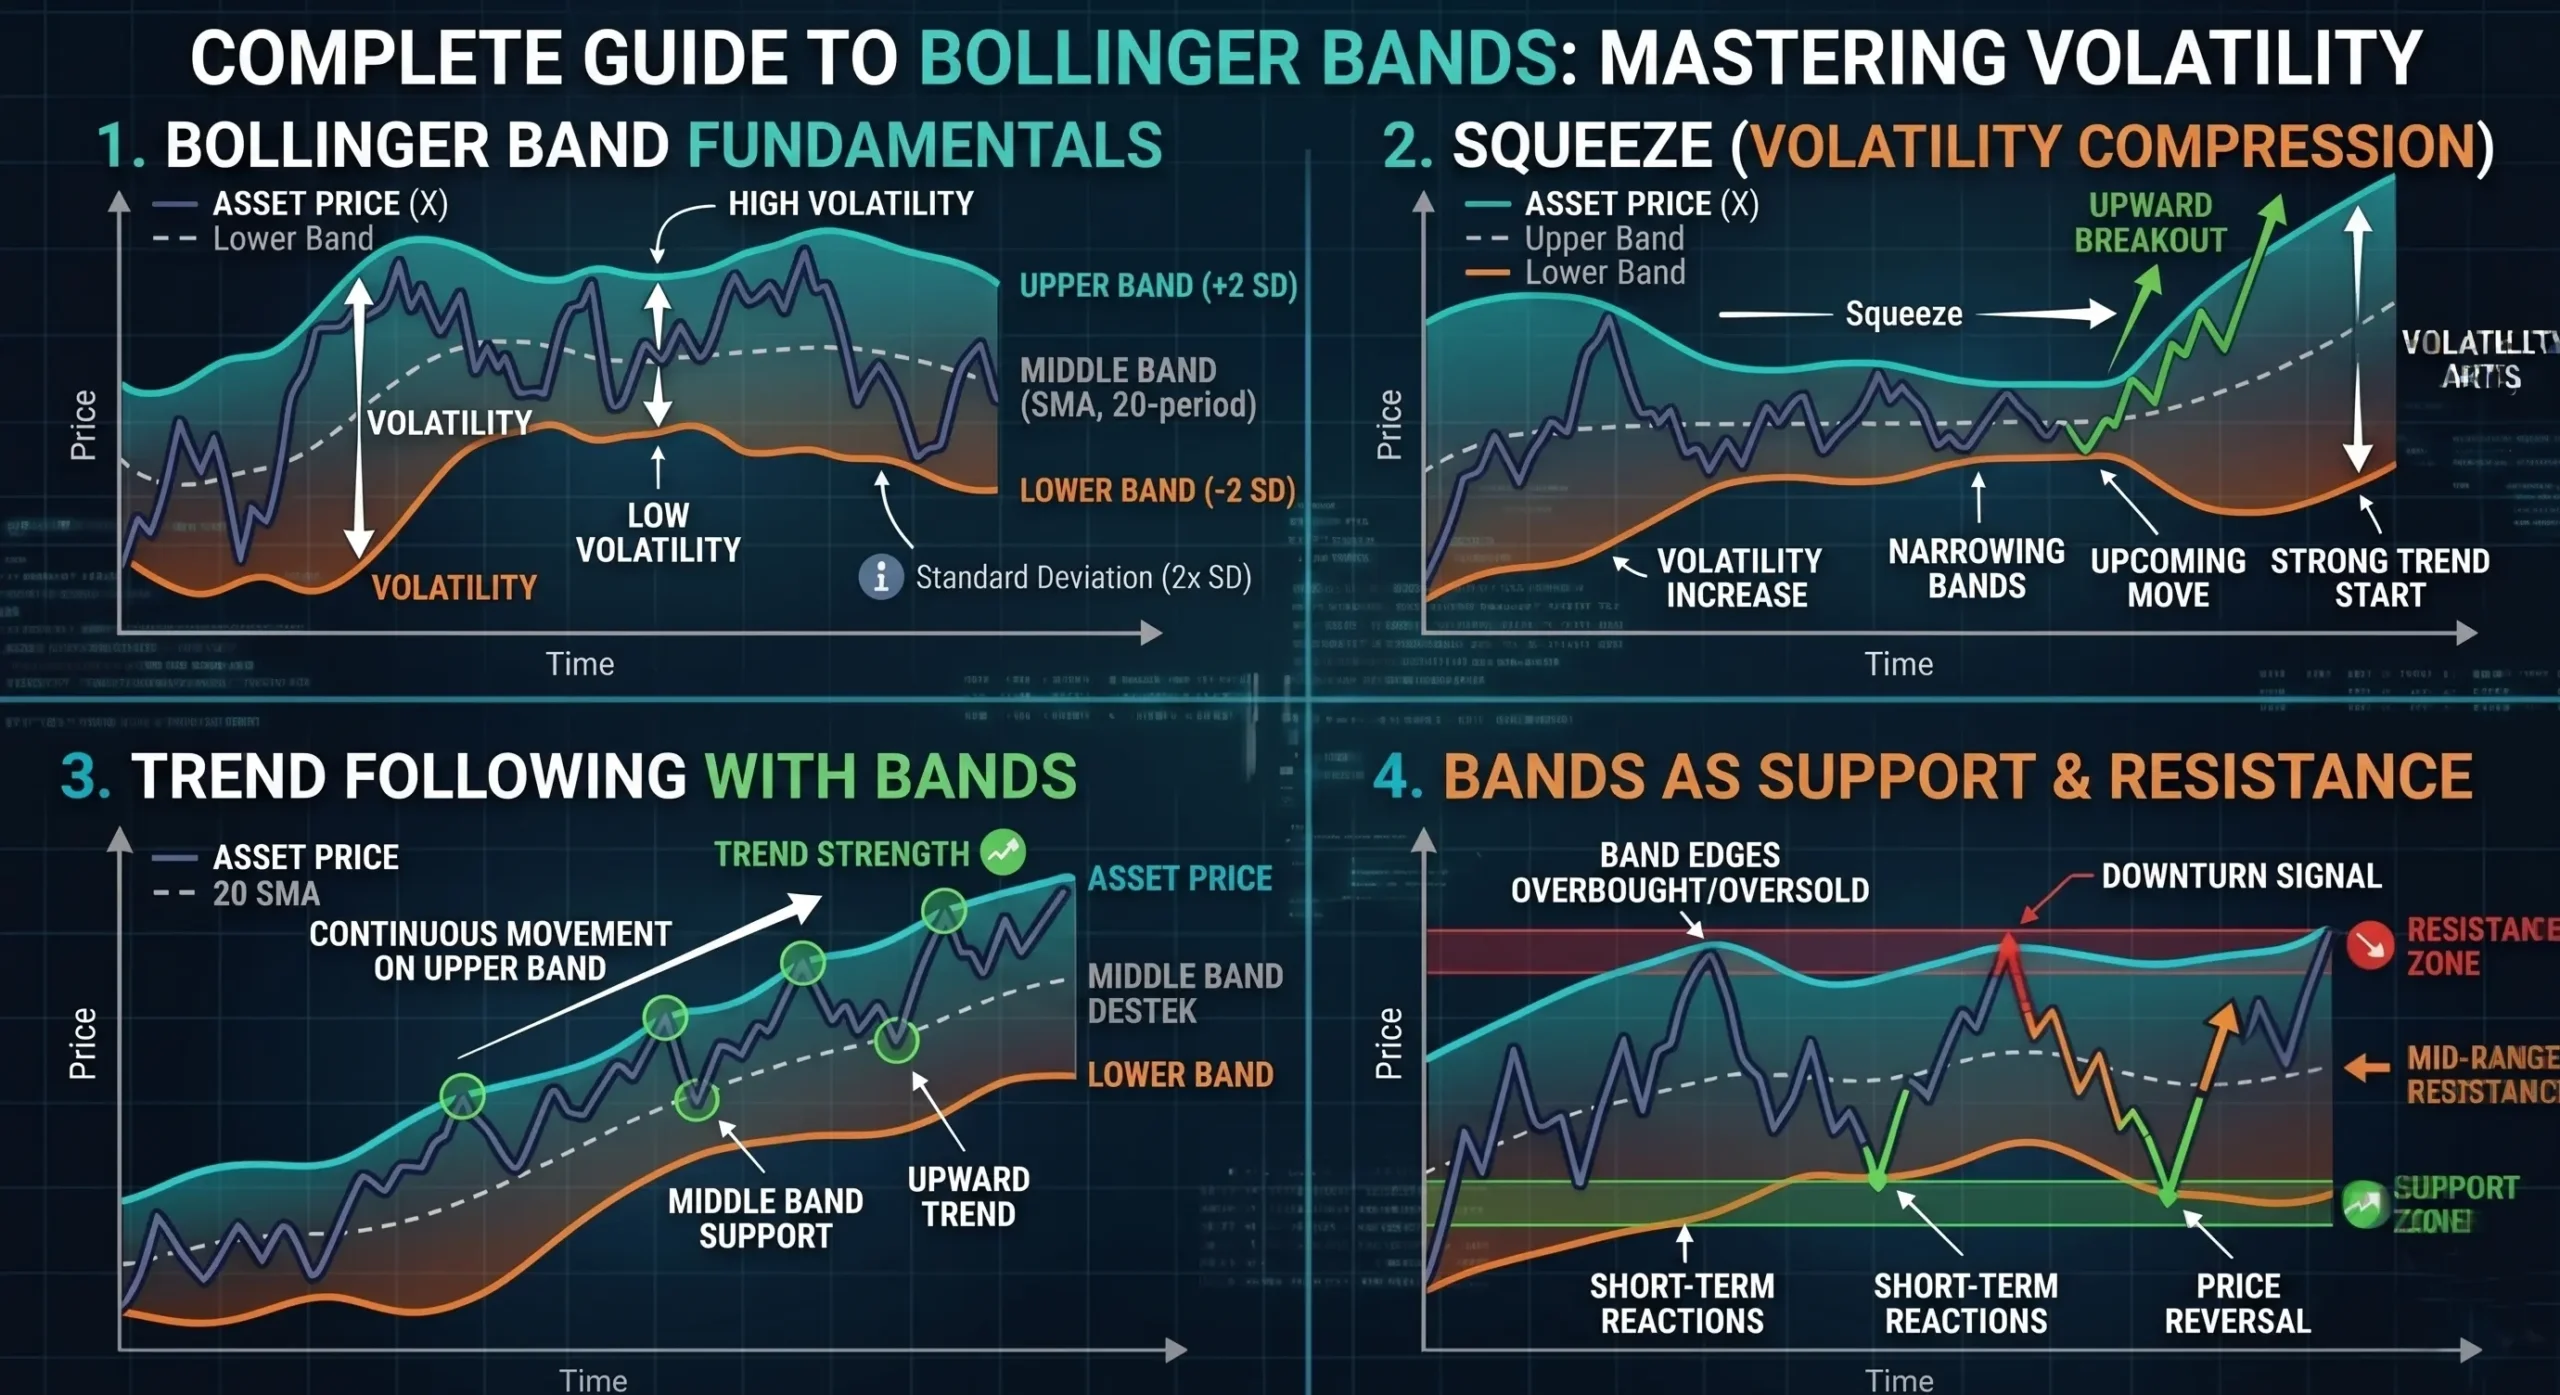
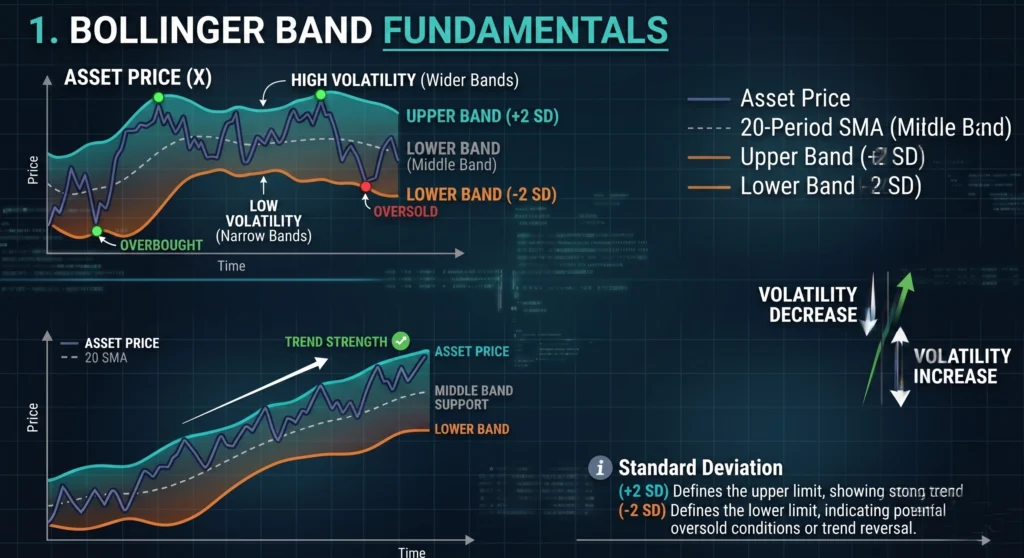
The indicator consists of three lines plotted directly on a price chart. The middle band is a simple moving average, typically set to 20 periods. The upper and lower bands are placed two standard deviations above and below that average. Because standard deviation measures how spread out price moves have been, the bands widen during volatile periods and tighten when price action quiets down.
What the Squeeze Reveals About Market Conditions
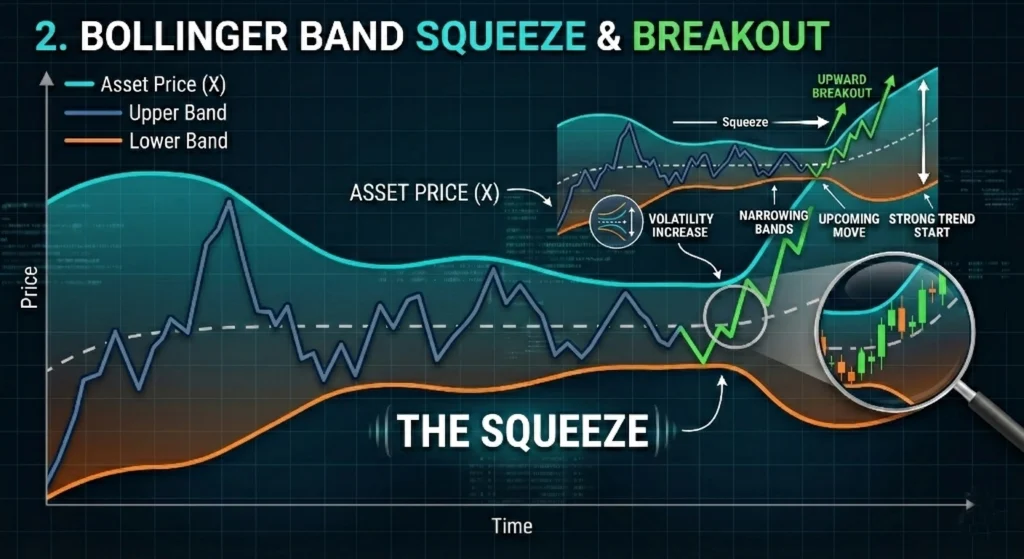
When the bands contract sharply, volatility has dropped to an unusually low level. This pattern — known as the squeeze — doesn’t predict direction, but it signals that a significant move is building. Historically, prolonged low-volatility phases tend to precede sharp breakouts.
Traders watch for the first decisive candle to close outside the narrowed bands as a potential entry signal, though confirmation from volume or a momentum indicator reduces false starts.
Reading Price Relative to the Bands
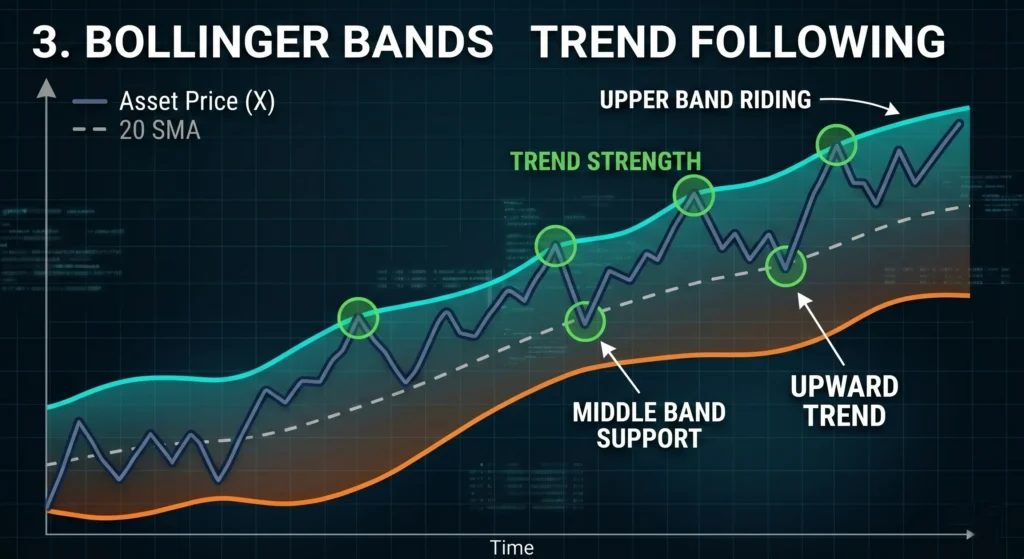
A common mistake is treating the upper band as resistance and the lower band as support. In trending markets, price can ride the upper or lower band for extended periods without reversing. A close above the upper band during a strong uptrend often reflects momentum, not overextension. The more useful question is whether price is consistently touching one band — which points to trend strength — or oscillating between both, which suggests a ranging environment where mean-reversion setups are more reliable.
The Role of the Middle Band
The 20-period moving average at the center of the indicator deserves more attention than it typically receives. In a trending market, price tends to pull back to the middle band and resume. When that pullback holds, it often confirms that the trend remains intact. A break and close below the middle band during an uptrend, on the other hand, shifts the structure and warrants reassessment. Treating the middle band as a dynamic reference point — rather than ignoring it in favor of the outer bands — adds a layer of context most traders miss.
Combining Bollinger Bands With Other Tools
Bollinger Bands measure volatility and relative price position, but they don’t measure momentum or volume. Pairing them with the Relative Strength Index (RSI) helps distinguish between a price touching the upper band with strong momentum versus one that’s reaching it while RSI diverges downward. Volume analysis adds a further dimension: a breakout from a squeeze on high volume carries more weight than one on thin participation. No single indicator operates well in isolation, and Bollinger Bands are no exception.
Adjusting Settings for Different Timeframes
The default 20-period, two-standard-deviation setting works reasonably well across daily charts, but shorter timeframes often benefit from tighter parameters. Scalpers on five-minute charts may prefer a 10-period average with 1.5 standard deviations to keep the bands responsive. Longer-term traders might extend to 50 periods for a smoother, less reactive channel. The key is consistency — changing settings frequently to fit past price action produces results that don’t hold up in real-time trading.
Using the Indicator With Discipline
Bollinger Bands reward traders who approach them as a volatility and context tool rather than a buy/sell signal generator. The bands define what’s normal for a given instrument over a given period — anything outside that range demands attention, not automatic action. Applied with patience and paired with confirmation, they offer a structured way to read market conditions that holds up across asset classes and timeframes.