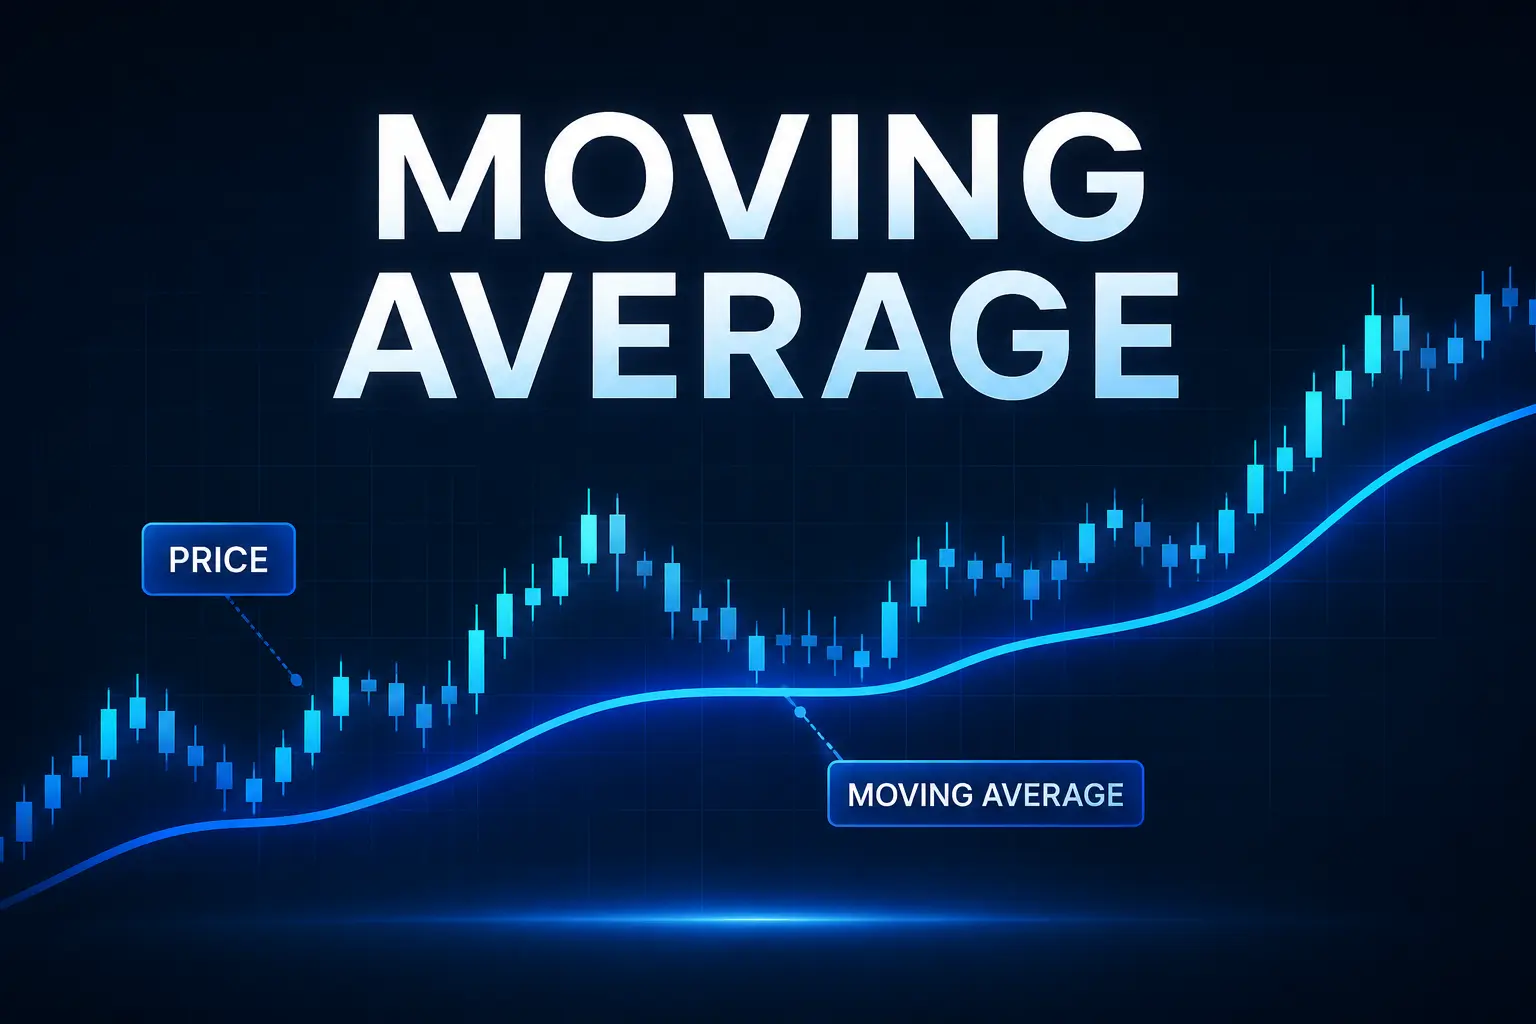
A moving average is one of the most widely used tools in trading because it simplifies price action. It removes short-term noise and helps traders focus on the overall direction of the market. Instead of reacting to every small fluctuation, traders can follow a smoother trend line.
This indicator calculates the average price over a chosen period and updates continuously. That behavior allows traders to track momentum without getting overwhelmed. It works across markets such as crypto, forex, and stocks.
Many beginners start with moving averages because they are intuitive and practical. They also integrate well with other concepts like support and resistance. Over time, traders build strategies around them.
What Is a Moving Average?
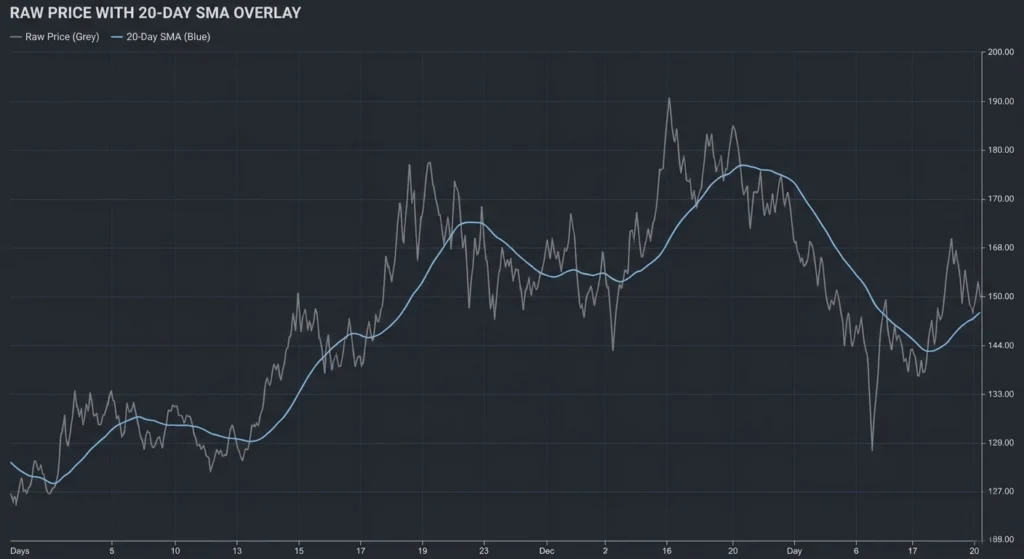
A moving average calculates the average price of an asset over a fixed number of periods. For example, a 20-period moving average reflects the last 20 candles. Each new candle replaces the oldest one, keeping the calculation dynamic.
This process smooths price movement and makes trends easier to identify. Sharp spikes become less distracting, and direction becomes clearer. Traders use this clarity to make more consistent decisions.
The moving average does not predict future prices. It reflects what has already happened in a more structured way. That makes it reliable for confirmation rather than prediction.
Why Traders Use a Moving Average
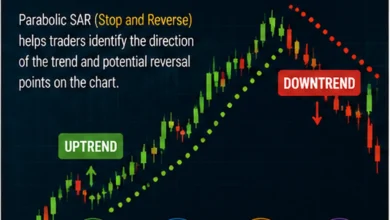
Traders rely on moving averages to define trend direction quickly. When price stays above the line, the market often shows strength. When price stays below, weakness tends to dominate.
Another key use is identifying dynamic support and resistance. Unlike static levels, moving averages adjust with price. This creates flexible zones where price may react repeatedly.
They also act as filters. Some traders only take long trades above a major moving average like the 200-period. This reduces noise and improves trade selection.
Types of Moving Average
Simple Moving Average (SMA)
The simple moving average calculates a straight average of prices. Every data point carries equal weight. This produces a smooth and stable line.
Traders often use the 50 SMA or 200 SMA to understand long-term trends. These levels can influence large market participants. Because of that, they often act as strong reference points.
The drawback is slower reaction speed. Sudden changes in price take longer to reflect in the SMA. That delay can affect timing.
Exponential Moving Average (EMA)
The exponential moving average gives more importance to recent prices. This makes it more responsive to new data. Traders who prefer faster signals often choose the EMA.
Short-term traders frequently use the 9 EMA or 20 EMA. These help identify quick pullbacks and momentum shifts. The faster response increases sensitivity but may also increase false signals.
Choosing between SMA and EMA depends on your approach. Slower averages suit long-term analysis, while faster ones suit active trading.
How to Use a Moving Average in Trading
The simplest method involves tracking price relative to the moving average. If price remains above a rising line, buyers likely control the trend. If price stays below a falling line, sellers dominate.
The slope of the moving average adds another layer of insight. A rising slope signals strength, while a flat line suggests consolidation. This helps traders avoid unclear market conditions.
Price reactions around the line matter as well. In strong trends, pullbacks toward the moving average often create trading opportunities. This behavior repeats across many markets.
Using Moving Average as Support and Resistance
A moving average often acts as a dynamic support or resistance level. In an uptrend, price may bounce from it multiple times. In a downtrend, it may block upward movement.
This creates structure in the chart. Traders can wait for price to return to these areas instead of chasing moves. That improves timing and risk control.
Still, confirmation remains important. Price action and volume should support the setup. A moving average alone should not define the entire trade.
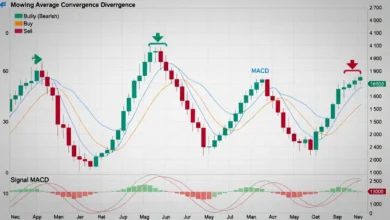
A crossover occurs when two moving averages intersect. A bullish signal forms when a shorter average crosses above a longer one. A bearish signal forms when it crosses below.
The 50 and 200 moving averages create one of the most recognized crossover signals. These are often called golden cross and death cross. They can indicate major trend shifts.
Crossovers work best in trending markets. In sideways conditions, they can produce false signals. Traders often combine them with structure and breakout levels.
Best Moving Average Settings for Beginners
There is no universal setting that works for every situation. Traders adjust periods based on their strategy and time frame. Short-term traders prefer faster averages, while long-term traders rely on slower ones.
A simple setup works best for beginners. The 20-period moving average helps track short-term trends. The 50-period moving average provides stronger confirmation.
Too many indicators can create confusion. Clean charts lead to clearer decisions. Keeping the setup simple improves focus.
Common Mistakes When Using a Moving Average
Many traders assume the moving average predicts reversals. This leads to poor entries. The indicator reflects trend, not future direction.
Another mistake involves ignoring market conditions. Moving averages perform poorly in sideways markets. Frequent crossovers create noise instead of signals.
Some traders also copy settings without understanding them. A strategy should match personal trading style. Blindly following numbers rarely works.