
Most traders open a chart, see the dots flip from below price to above price, and treat it as a clean sell signal. That’s the textbook explanation, and it’s also the fastest way to get chopped up in a sideways market. Parabolic SAR was built for one specific job — trailing a stop in a trending market — and it does that job well. The trouble starts when it gets used as an entry signal in conditions it was never designed for.
This guide covers what Parabolic SAR is actually calculating, where it consistently breaks down, and how it’s more useful as a stop-management tool than a standalone trigger.
What Parabolic SAR Is
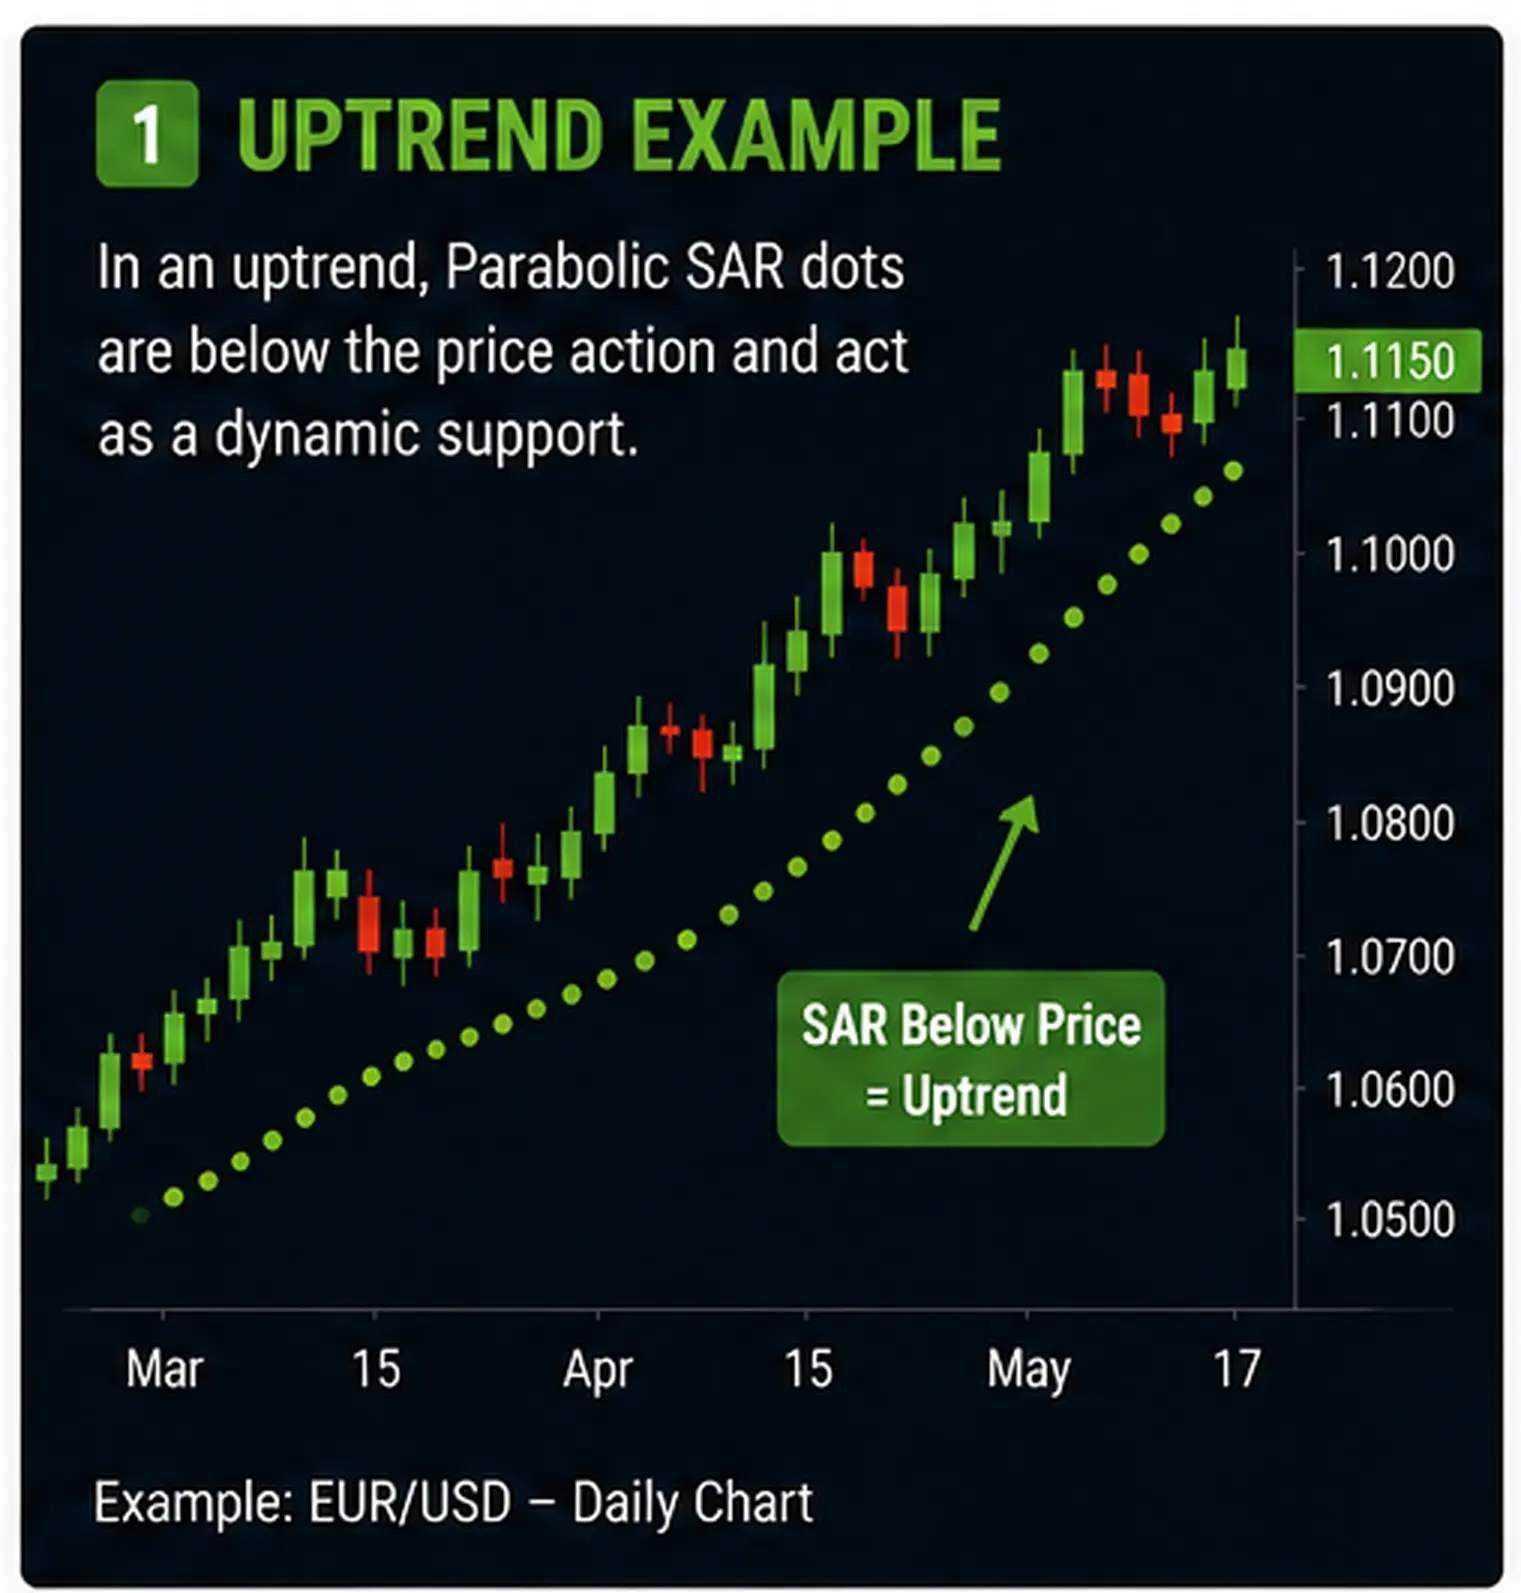
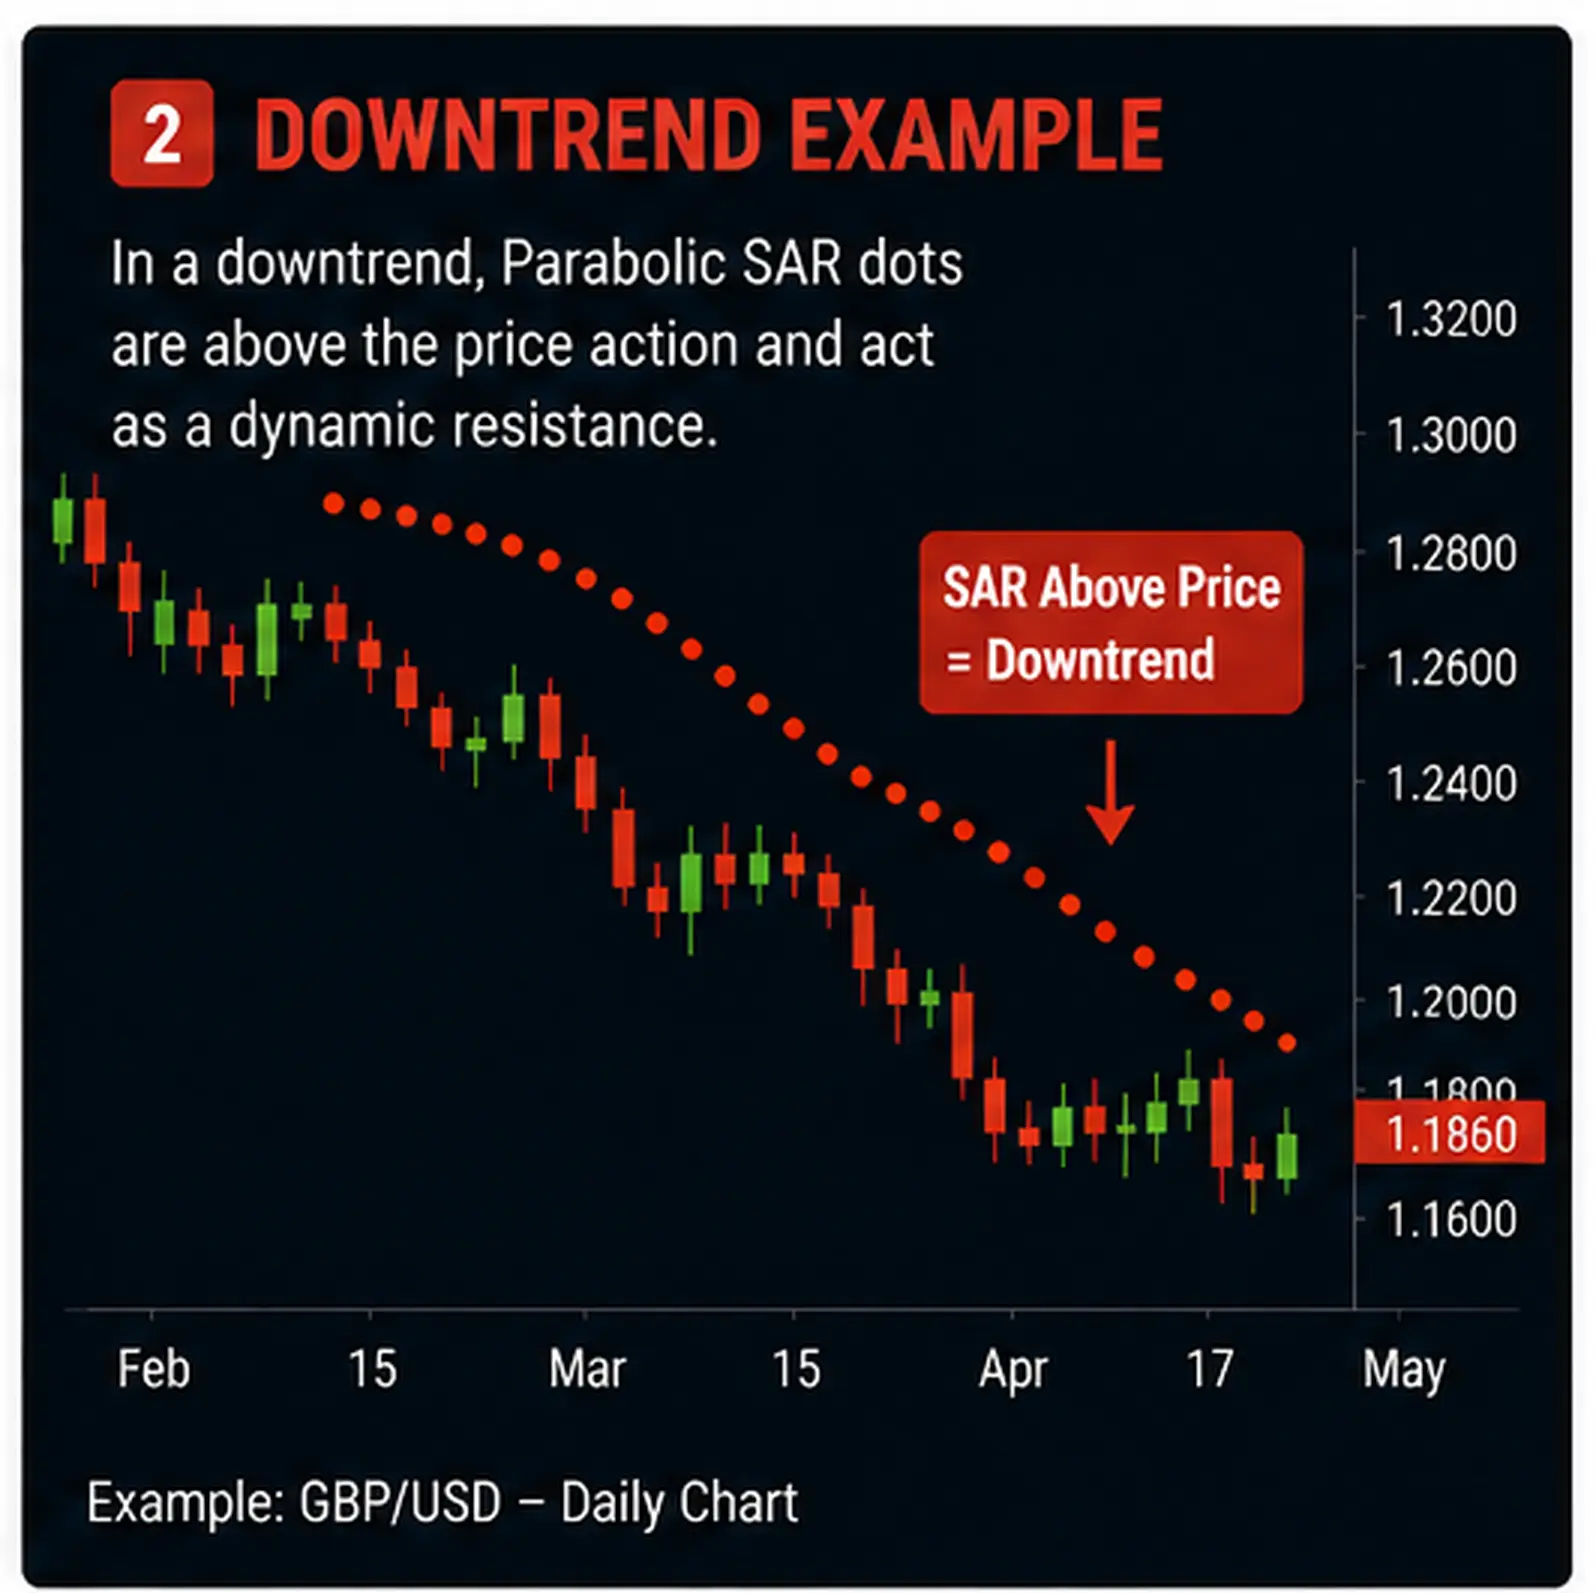
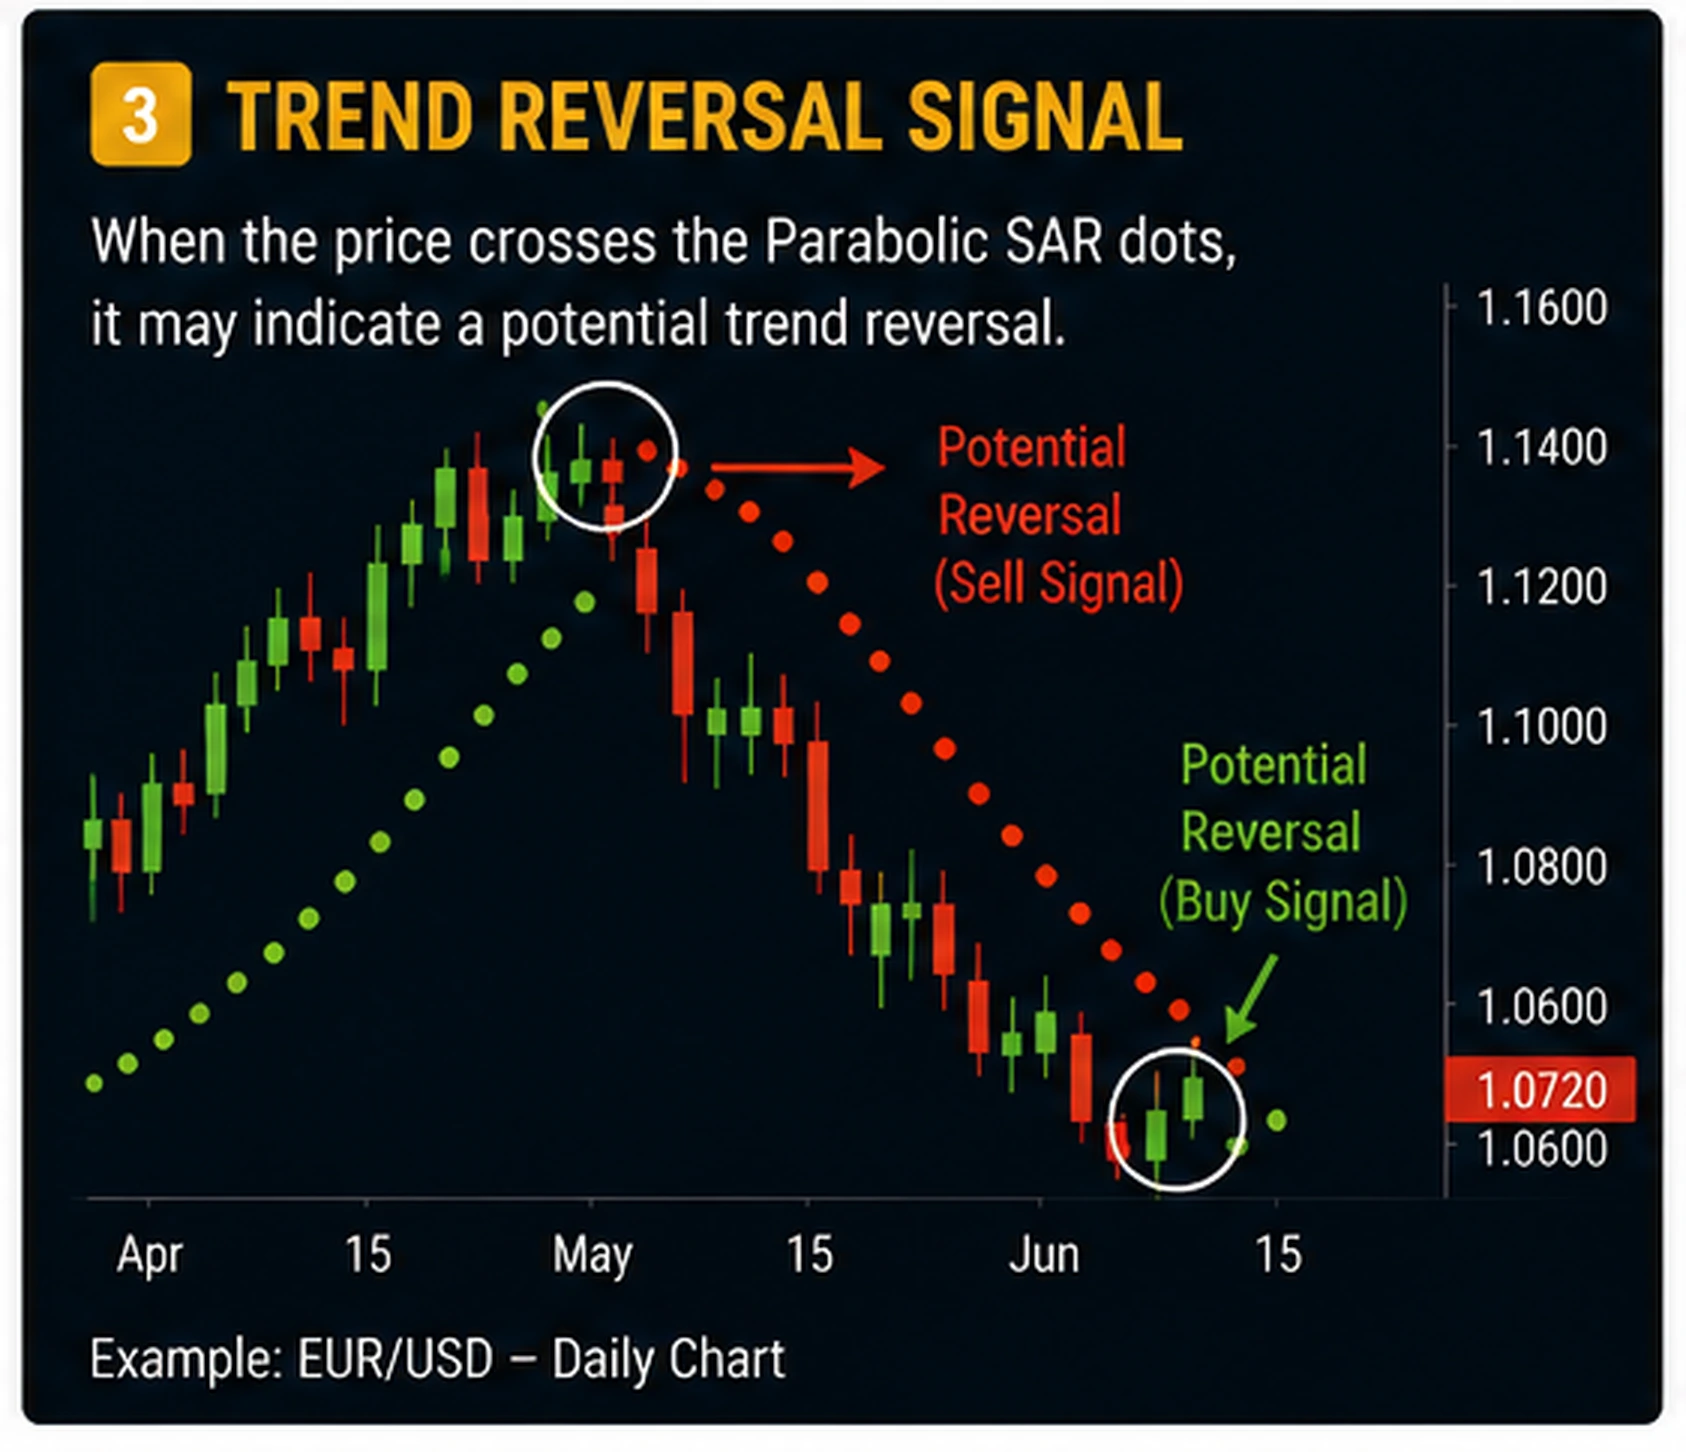
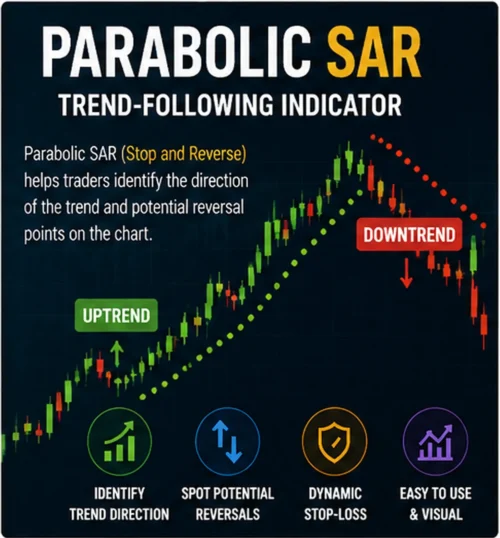
Parabolic SAR (“Stop and Reverse”) is a trend-following indicator developed by J. Welles Wilder, plotted as a series of dots either above or below the price bars. When the dots sit below price, the trend is read as bullish; when they flip above price, it’s read as bearish.
The “parabolic” part of the name comes from how the indicator behaves as a trend matures: the dots start out trailing price loosely, then accelerate and hug the price action more tightly the longer the trend runs. This acceleration is controlled by a step factor (commonly starting at 0.02 and increasing by 0.02 up to a maximum, usually 0.20) that governs how aggressively the SAR line tightens over time.
How the Calculation Actually Works
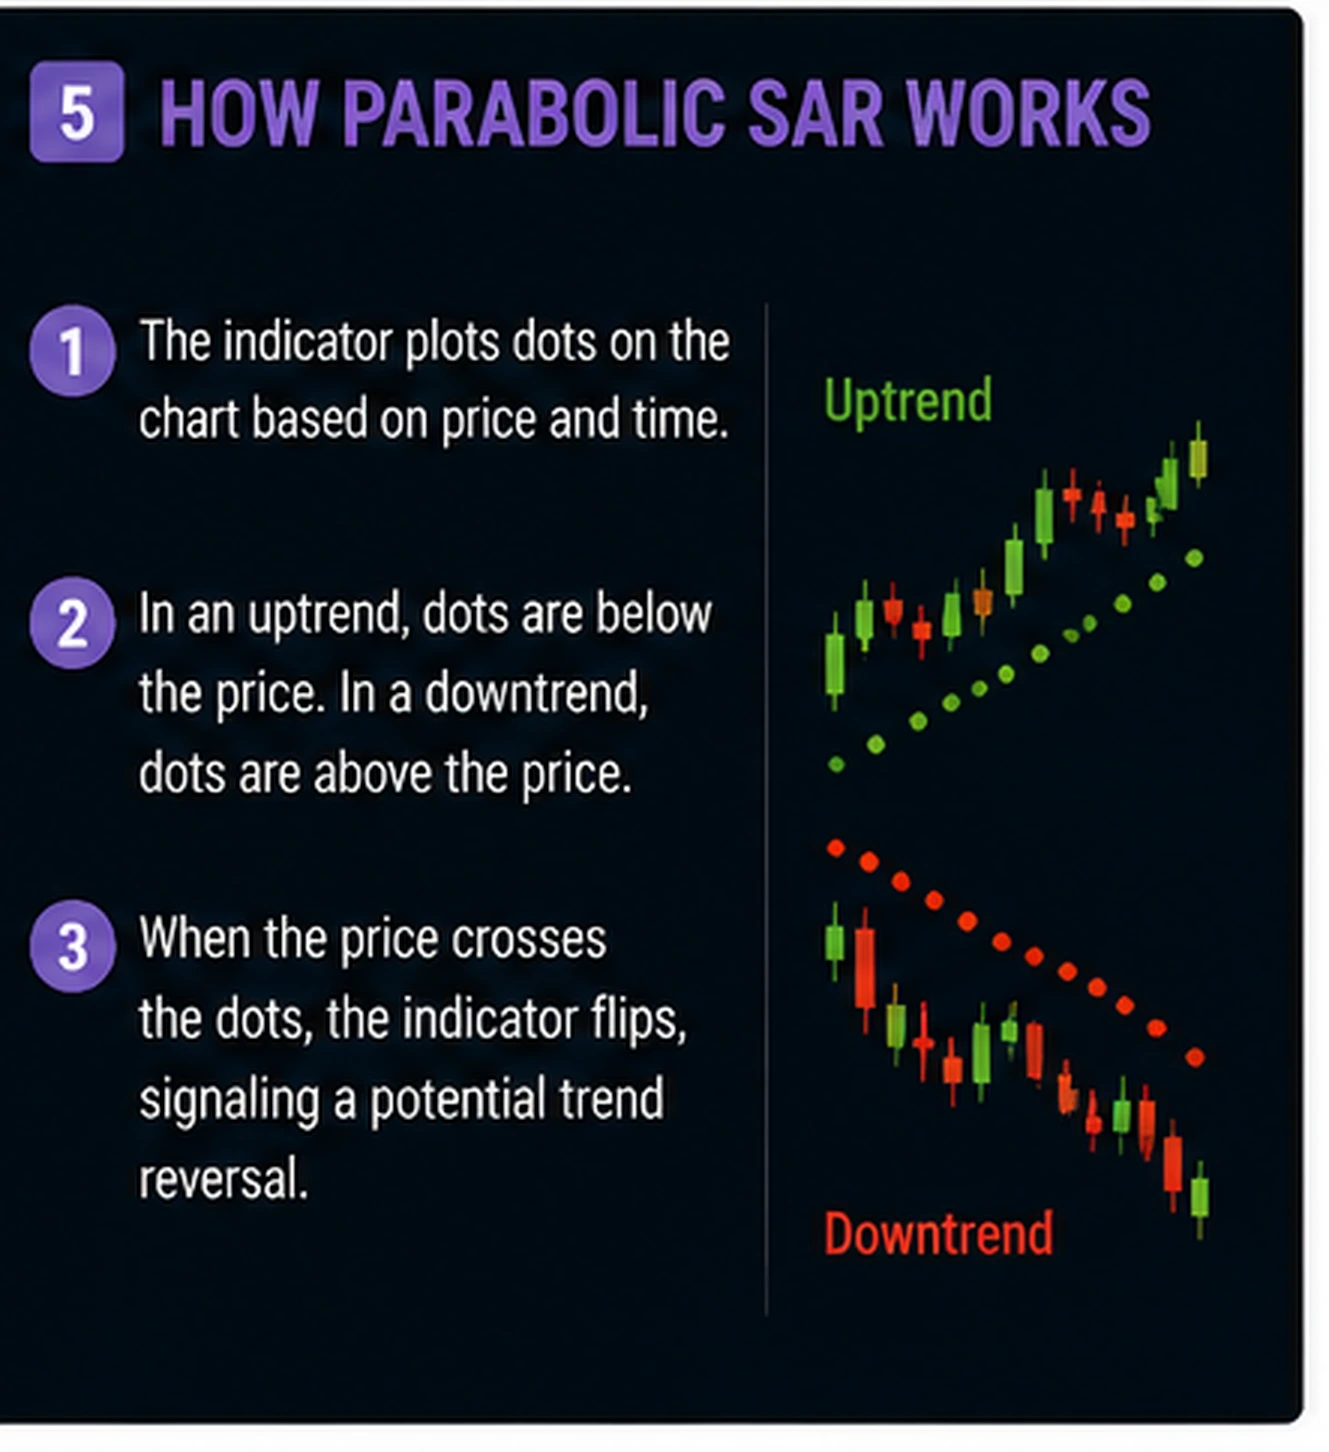
Each new SAR value is based on three inputs: the prior SAR value, the extreme point (the highest high or lowest low reached during the current trend), and the acceleration factor. In an uptrend, the formula is:
SAR(next) = SAR(current) + AF × (EP − SAR(current))
The acceleration factor increases every time a new extreme point is set, which is what produces the parabolic curve. This detail matters practically: SAR doesn’t react to price momentum directly — it reacts to whether new highs (or lows) are being made. A trend that grinds sideways without setting fresh extremes will cause SAR to stall, even if price hasn’t actually reversed.
Field note: The most common misunderstanding we see is traders assuming a SAR flip means momentum has changed. Often it just means the acceleration factor caught up to price during a pause, not that the trend actually reversed. Checking a higher timeframe before acting on a flip filters out a large share of these false signals.
Why Parabolic SAR Struggles in Range-Bound Markets
SAR is built on the assumption that price is trending. In a ranging or choppy market, the dots will flip back and forth repeatedly as price oscillates, generating a string of signals that arrive too late and reverse too fast to be tradeable. This is the single most common complaint about the indicator, and it’s less a flaw than a mismatch of tool and condition.
A practical filter: check the Average Directional Index (ADX) alongside SAR. When ADX is low (commonly below 20–25), the market isn’t trending strongly enough for SAR signals to be reliable, regardless of what the dots are doing.
Parabolic SAR vs. Moving Averages
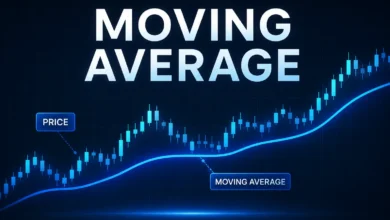
Both are trend tools, but they answer different questions. A moving average smooths price to show the general direction and is comparatively slow to react. Parabolic SAR is faster and more sensitive, which makes it better suited to trailing an existing position than to identifying a trend in the first place.
A combination that holds up reasonably well: use a moving average (or a longer-term trend filter) to establish direction, and use Parabolic SAR only to manage the exit once a position is already open in that direction. Using SAR for both entry and exit tends to produce far more whipsaws than using it for exits alone.
Using Parabolic SAR as a Trailing Stop
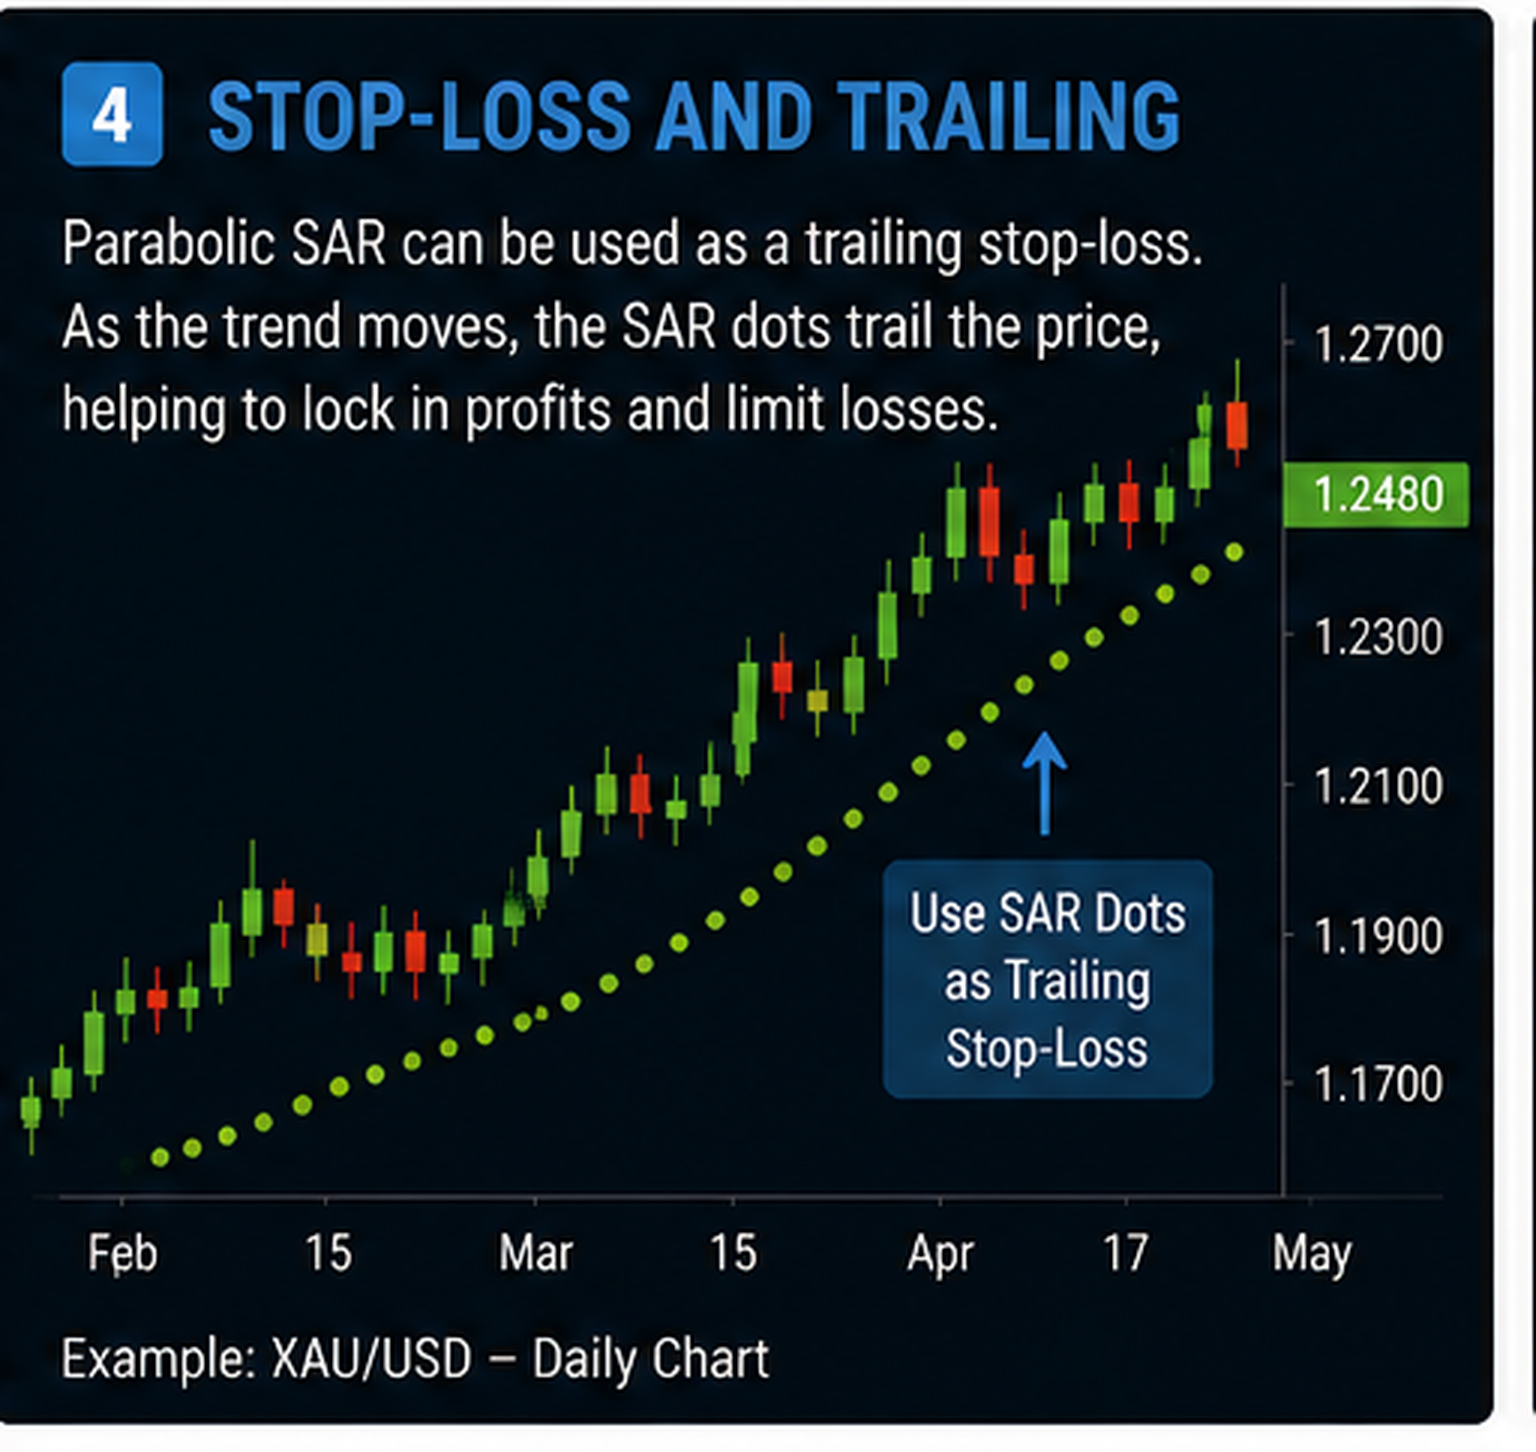
This is where the indicator earns its keep. Because the dots move with price and tighten as a trend extends, they function naturally as a trailing stop-loss level:
- In a long position, the SAR dot below price marks a reasonable stop level, adjusted upward as the trend continues.
- In a short position, the SAR dot above price marks the stop, adjusted downward as the trend continues.
The acceleration built into the formula means the stop tightens automatically as the trend matures — which helps lock in gains during a strong move, but can also mean the stop moves uncomfortably close to price during a fast run. Traders who find the standard settings too tight sometimes reduce the acceleration factor (e.g., starting at 0.01 instead of 0.02) to give the trade more room, at the cost of giving back more profit on a reversal.
Common Mistakes to Avoid
- Trading every flip as a signal. In choppy conditions this generates far more false signals than genuine reversals.
- Ignoring the broader trend context. SAR reacts to short-term price extremes; it has no awareness of the larger structure unless you add one.
- Using default settings on every timeframe and instrument. The 0.02/0.20 defaults were designed decades ago for a specific style of trading; volatile instruments often need a lower acceleration factor to avoid premature stop-outs.
- Treating SAR as a standalone system. It’s most reliable as one component — typically a stop-management tool — paired with a separate method for identifying trend direction and strength.
Frequently Asked Questions
Is Parabolic SAR good for day trading?
It can work on short timeframes, but the false-signal problem in range-bound conditions is amplified on lower timeframes, where price spends more time consolidating. Combining it with a trend-strength filter like ADX generally improves reliability.
What’s the best acceleration factor to use?
There’s no universal answer — it depends on the instrument’s volatility and the trader’s tolerance for early stop-outs versus giving back profit. The 0.02 starting value and 0.20 maximum are the historical defaults, but many traders adjust them for specific markets.
Can Parabolic SAR be used on its own?
It can, but its reliability drops considerably outside strongly trending conditions. Pairing it with a trend or momentum filter is standard practice among traders who rely on it regularly.
Does Parabolic SAR work on all asset classes?
It’s applied across stocks, forex, crypto, and futures, but its trend-following logic performs better on instruments that trend cleanly and worse on instruments that spend extended periods consolidating.
Why does Parabolic SAR sometimes seem to lag?
Because the acceleration factor resets whenever a new extreme point isn’t made, SAR can stall during pauses within a trend, which reads as lag even though the underlying trend hasn’t actually reversed.