
A price breakout can look convincing on a chart, yet the trading volume behind it may tell a different story. A stock might rise sharply with relatively little participation, while another moves only a few percent as trading activity expands well beyond its normal level. Looking at price alone makes these situations difficult to distinguish.
Volume in trading measures how much of an asset changes hands during a specific period. It helps traders evaluate market participation, compare current activity with historical patterns, and judge whether a price movement has meaningful support.r
Volume does not predict where prices will go next. Its value comes from understanding the relationship between trading activity, price structure, and the broader market environment.
What Is Volume in Trading?
Trading volume represents the quantity of an asset traded over a defined period. In stock markets, it is commonly measured in shares. In cryptocurrency markets, platforms may report volume in the base asset or its quote currency, while futures markets often measure activity in contracts.
For example, if a stock reports a daily trading volume of 2 million shares, that means 2 million shares were traded during the session. It does not mean that 2 million shares were purchased without corresponding sales. Every completed transaction involves both a buyer and a seller.
Volume bars are typically displayed beneath the price chart. Each bar corresponds to the trading activity recorded during the same interval as the price candle.
A daily chart shows daily trading volume, while a one-hour chart displays volume for each hourly period. Changing the timeframe changes how the information is grouped and may reveal different participation patterns.
The color of a volume bar generally follows the associated price candle or the platform’s selected color rules. A green volume bar should not automatically be interpreted as evidence that buyers outnumbered sellers. Standard volume measures total executed activity, not the number of aggressive buyers versus aggressive sellers.
How Does Volume Help Confirm a Price Trend?
Volume becomes more useful when examined alongside the direction and structure of price movements.
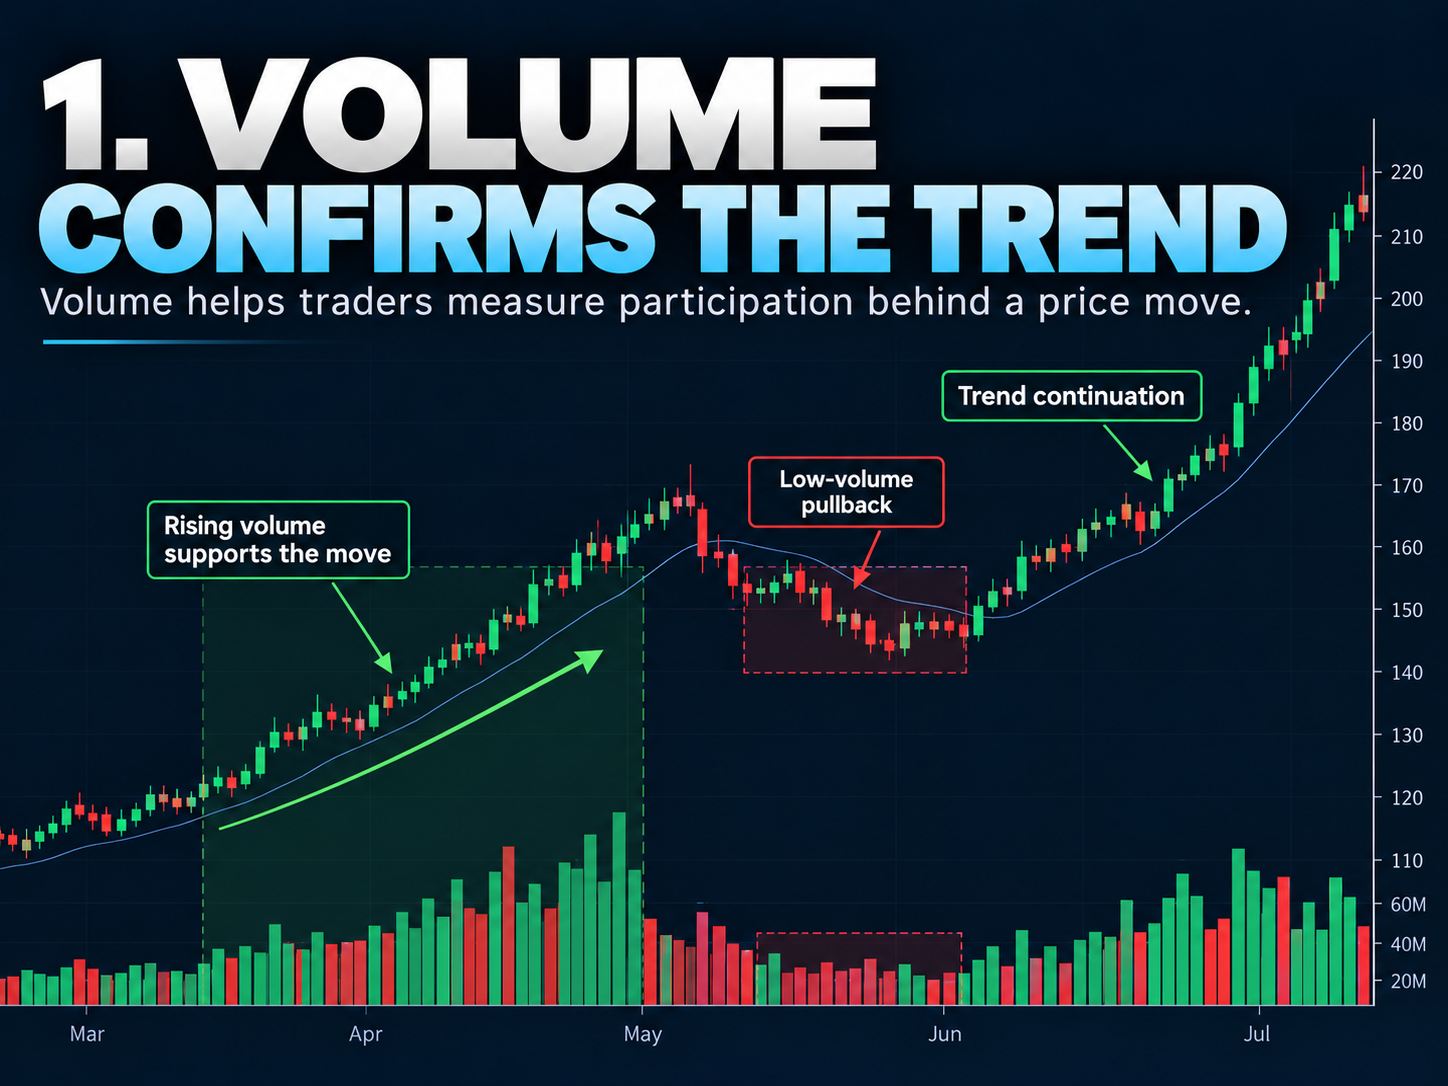
During an uptrend, traders generally look for higher highs and higher lows. If advances are accompanied by stronger trading activity, the movement may have broader market participation behind it.
Consider a stock that rises from $100 to $115 while its daily volume gradually increases from 800,000 to 1.5 million shares. The price advance and expanding participation support the interpretation that demand is attracting greater activity.
The same stock might subsequently retreat toward $110 while volume falls to 600,000 shares. Such a pullback may represent relatively limited participation compared with the preceding advance.
However, this relationship is not a fixed rule. Strong trends can develop without consistently increasing volume, and declining volume during a pullback does not guarantee that the original trend will resume.
Rising Volume During an Uptrend
An increase in trading volume alongside rising prices may indicate growing interest in an asset.
Rather than evaluating a single large volume bar, examine whether participation expands across multiple sessions and whether the price continues to establish a constructive market structure.
A large volume bar followed by immediate selling pressure deserves a different interpretation from a high-volume advance that continues to hold its gains.
Volume During a Downtrend
Increasing volume during falling prices can indicate strong participation in the decline. This may occur when market participants reduce exposure, liquidate positions, or respond to changing expectations.
If prices establish lower highs and lower lows while trading activity remains elevated, the downtrend may have substantial participation.
A decline accompanied by unusually low volume can suggest reduced activity, but it does not establish that selling pressure has ended.
The location of the movement matters. A low-volume decline into an established support area is different from a low-volume breakdown through a major technical level.
What Does Volume Divergence Tell Traders?
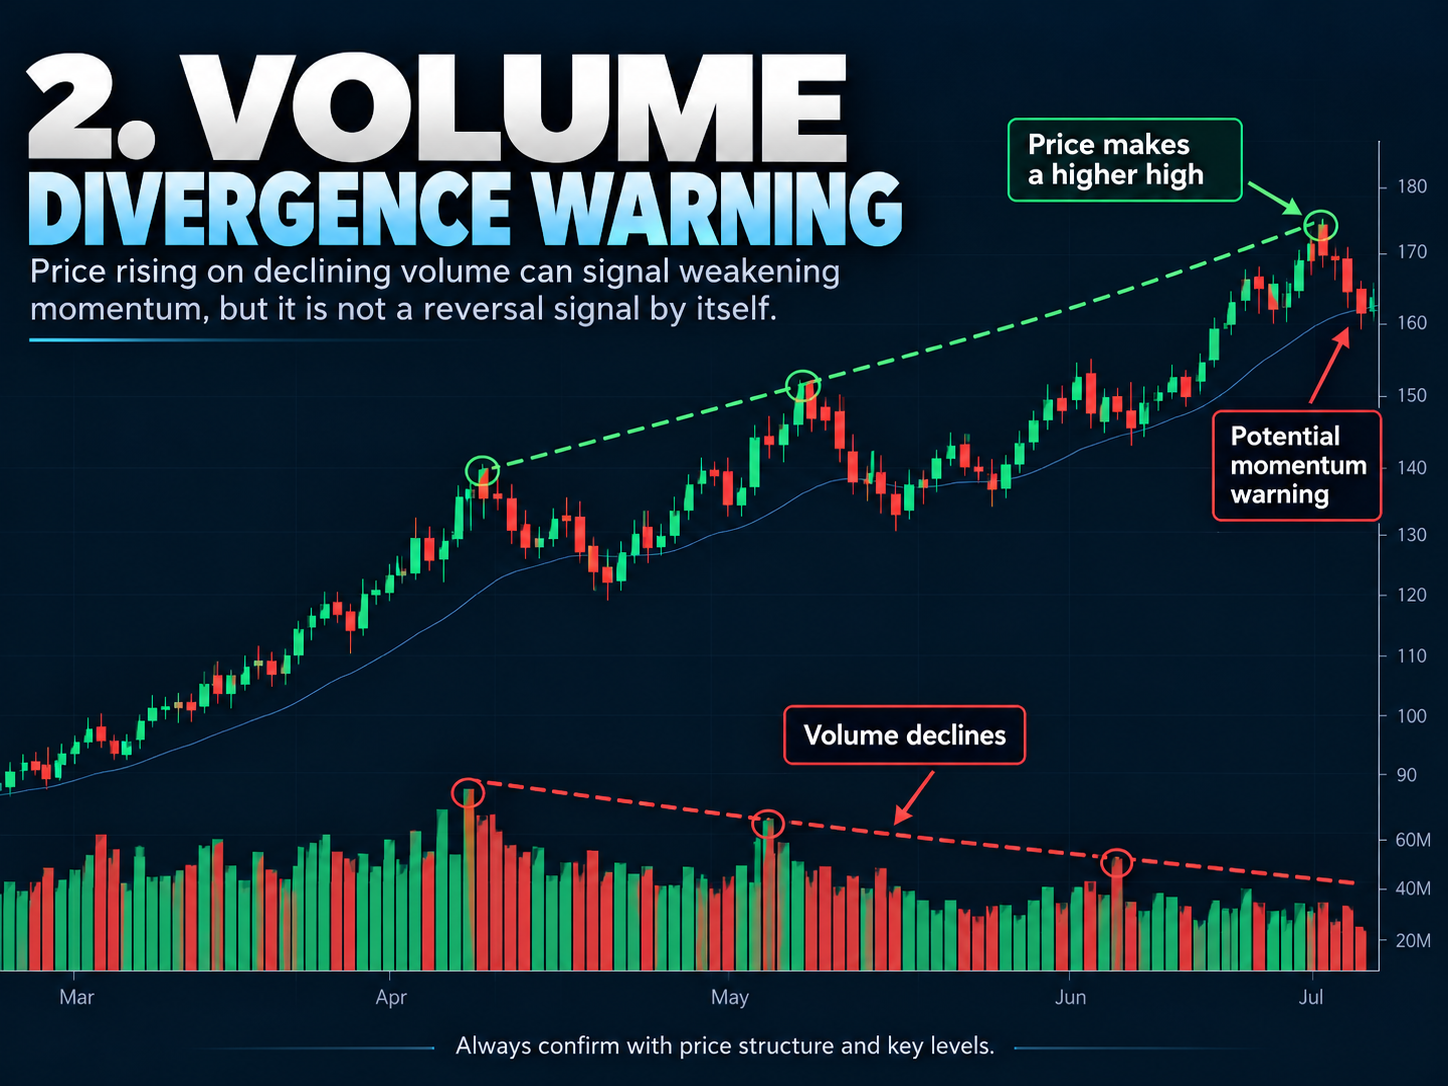
Volume divergence occurs when price behavior and trading activity move in different directions.
One example appears when prices establish successive higher highs while the volume accompanying those advances becomes progressively weaker.
Suppose a stock reaches $120 on 3 million shares of volume. Several weeks later, it advances to $128, but the relevant trading session records only 1.4 million shares.
The higher price has been achieved with less trading activity. This may raise questions about the strength of participation behind the latest advance.
It would nevertheless be premature to interpret the difference as an automatic sell signal.
Volume naturally varies between sessions, and differences in market conditions, trading hours, scheduled announcements, and liquidity can affect the comparison.
For that reason, volume divergence becomes more useful when combined with other evidence, such as a failed resistance breakout, weakening momentum, or a break in the existing market structure.
Can Price Continue Rising on Declining Volume?
Yes. A sustained price advance does not require volume to increase during every session.
Prices can rise when available selling liquidity is limited, even if overall trading activity is modest.
Declining volume may indicate reduced participation, but it does not reveal the number of available buyers and sellers at each price level or establish whether a reversal is imminent.
A more useful question is whether the existing trend structure remains intact.
If the price continues to establish higher lows, holds above relevant support, and avoids significant breakdowns, declining volume alone may not justify a bearish conclusion.
How to Compare Current Volume With Normal Trading Activity
An isolated volume reading has limited meaning without a reference point.
Trading 5 million shares might be ordinary for a highly liquid company but extraordinary for a smaller stock that typically trades only 300,000 shares per day.
Traders often use a volume moving average to establish a historical baseline.
A 20-period volume moving average, for example, calculates the average volume over the previous 20 candles.
This makes it easier to identify sessions where activity is meaningfully above or below the recent norm.
Relative Volume (RVOL)
Relative Volume compares the current trading volume with a selected historical average.
Relative Volume = Current Volume / Average Volume
Consider the following example:
| Measurement | Value |
|---|---|
| Current daily volume | 3,600,000 shares |
| Average daily volume | 1,500,000 shares |
| Relative Volume | 2.4 |
An RVOL reading of 2.4 means the session’s trading activity is 2.4 times the selected average.
A reading above 1 indicates greater activity than the reference average, while a reading below 1 indicates lower activity.
RVOL should not be treated as a universal trading threshold. The relevant comparison depends on the asset, timeframe, market session, and calculation method.
Intraday traders should also account for the time of day. Comparing volume during the first 30 minutes of trading with the average volume of an entire session would produce a misleading result.
A more meaningful intraday comparison uses historical volume from equivalent time intervals.
How Can Volume Help Evaluate a Breakout?
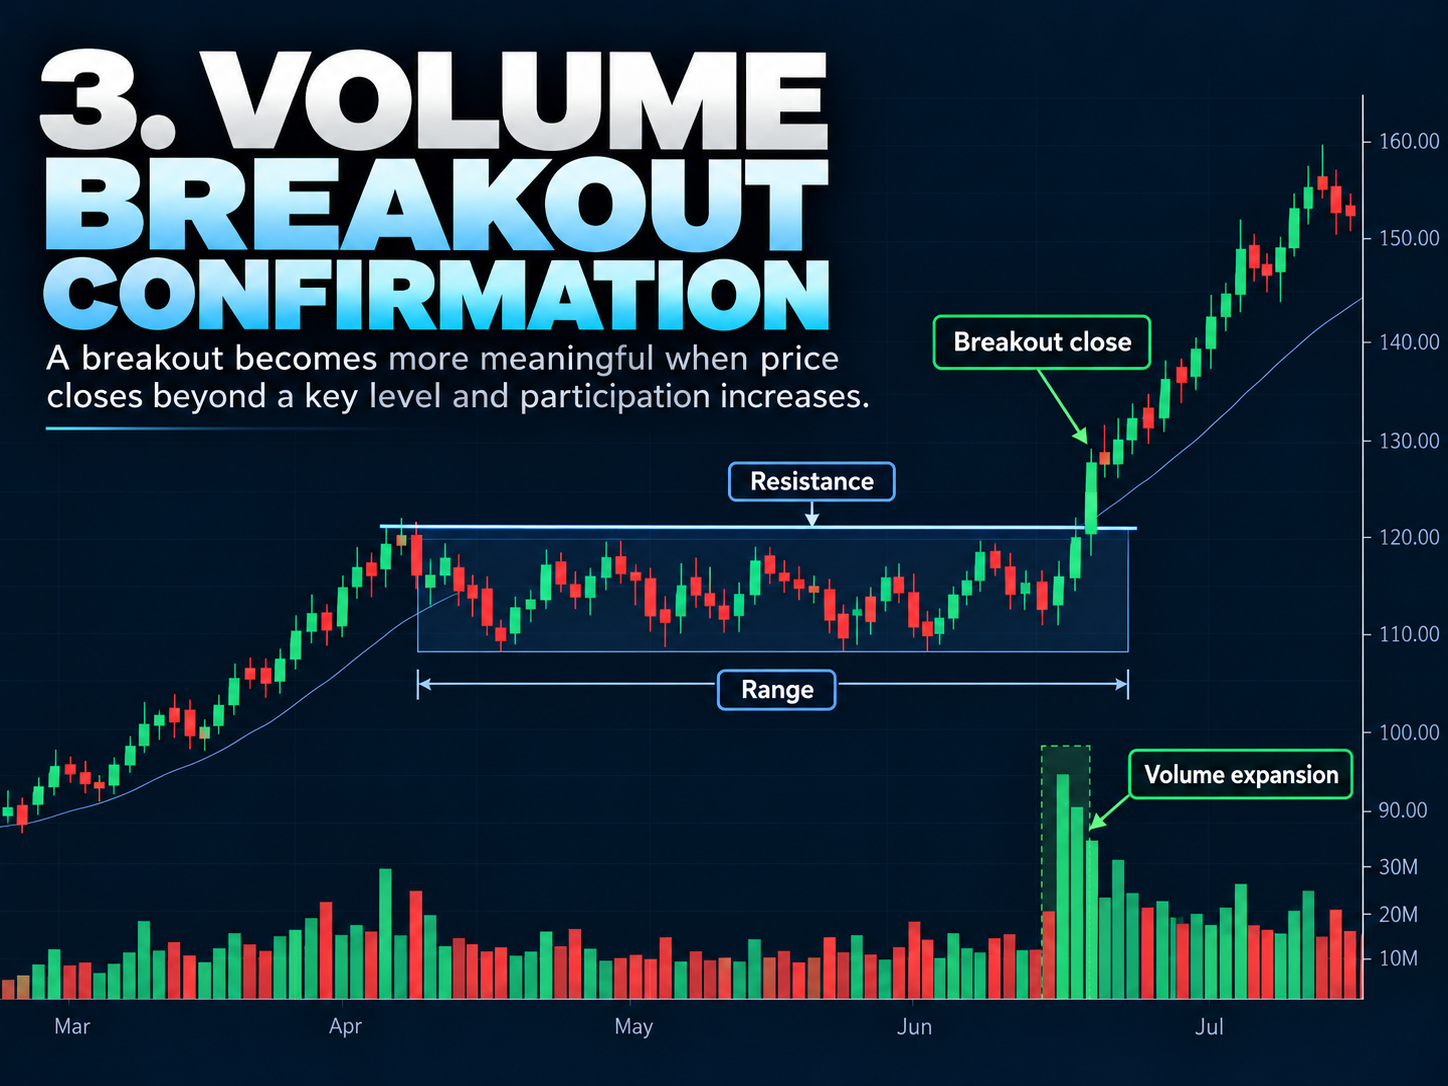
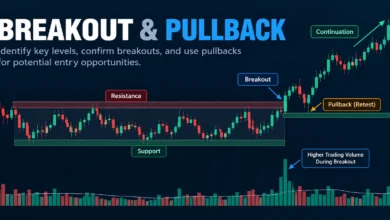
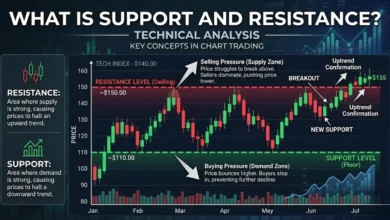
A breakout occurs when price moves beyond an established technical level, such as resistance, support, or the boundary of a trading range.
Volume can provide additional information about participation during that move.
Imagine a stock that repeatedly struggles to move above $75. After several unsuccessful attempts, it closes at $77.20 on volume substantially higher than its recent average.
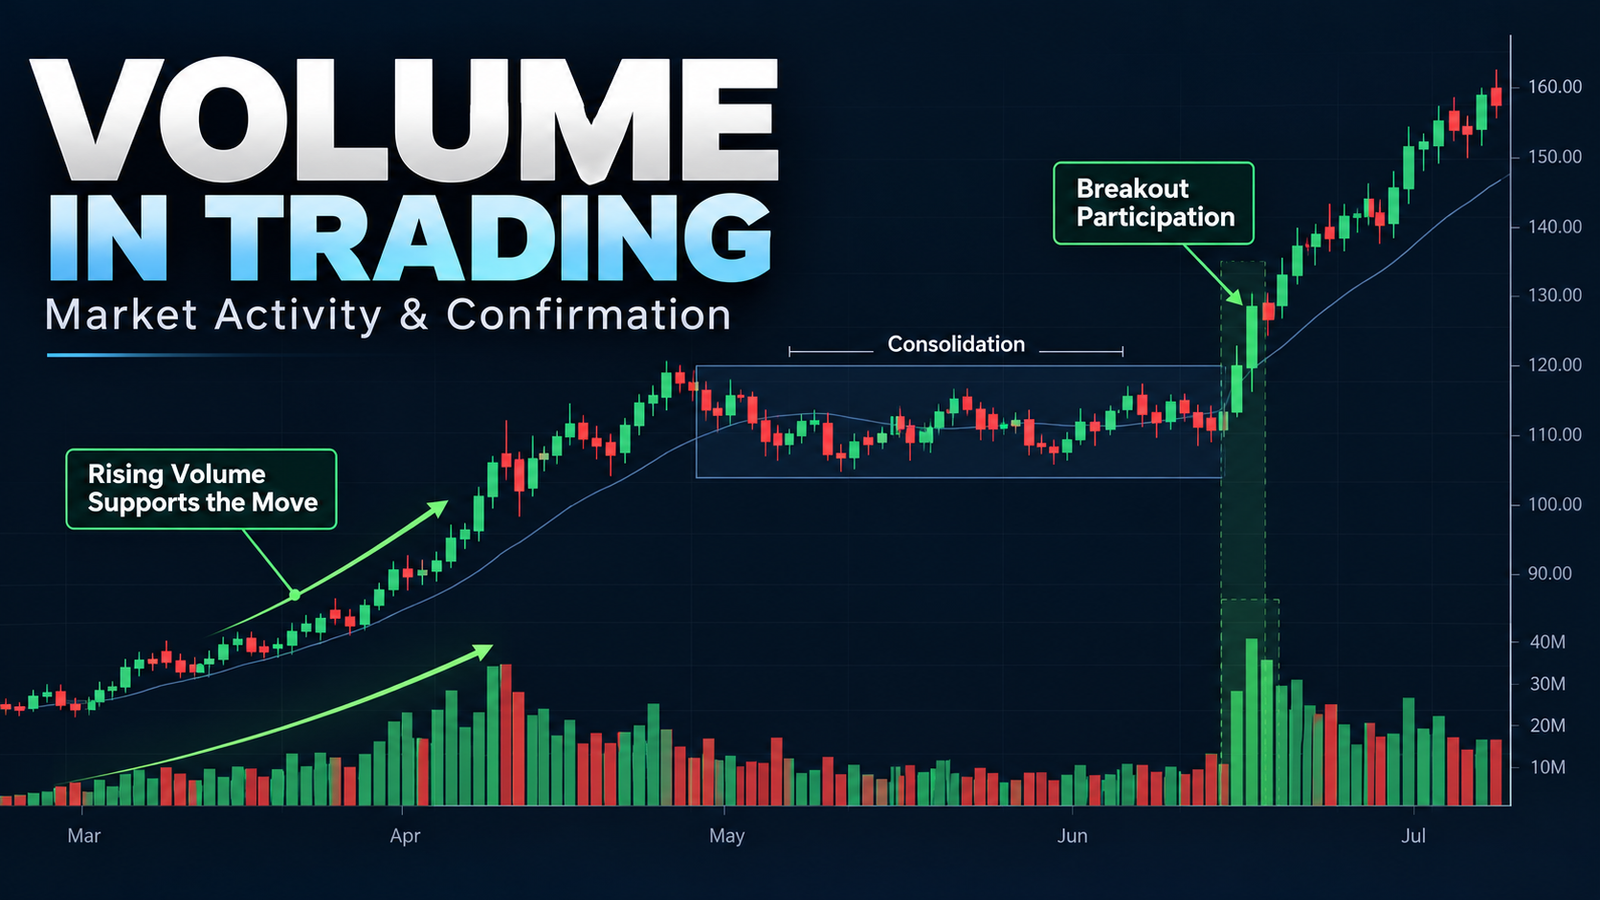
The price has moved beyond resistance, and the increased trading activity suggests stronger participation during the breakout.
This combination can make the move more noteworthy than a brief rise above resistance on unusually low activity.
Still, strong volume does not guarantee a successful breakout.
Prices can reverse after high-volume breakouts, particularly when the movement encounters additional resistance or when aggressive activity reflects short-term speculation rather than sustained demand.
A breakout should be evaluated through the closing price, the location of the broken level, subsequent price behavior, and the prevailing market trend.
Why Low-Volume Breakouts Require Caution
A breakout on relatively low volume may indicate that fewer transactions occurred during the move.
This can make the signal harder to interpret, particularly in thinly traded markets where prices may move substantially with limited activity.
However, low-volume breakouts are not automatically invalid. Some trends begin during quiet conditions and attract additional participation later.
Instead of rejecting every low-volume breakout, traders can monitor whether price holds beyond the broken level and whether participation increases during subsequent advances.
The distinction between an initial breakout and its later confirmation deserves attention. A price move beyond resistance is an event; maintaining that new price structure is a separate test.
What Is a Volume Climax?
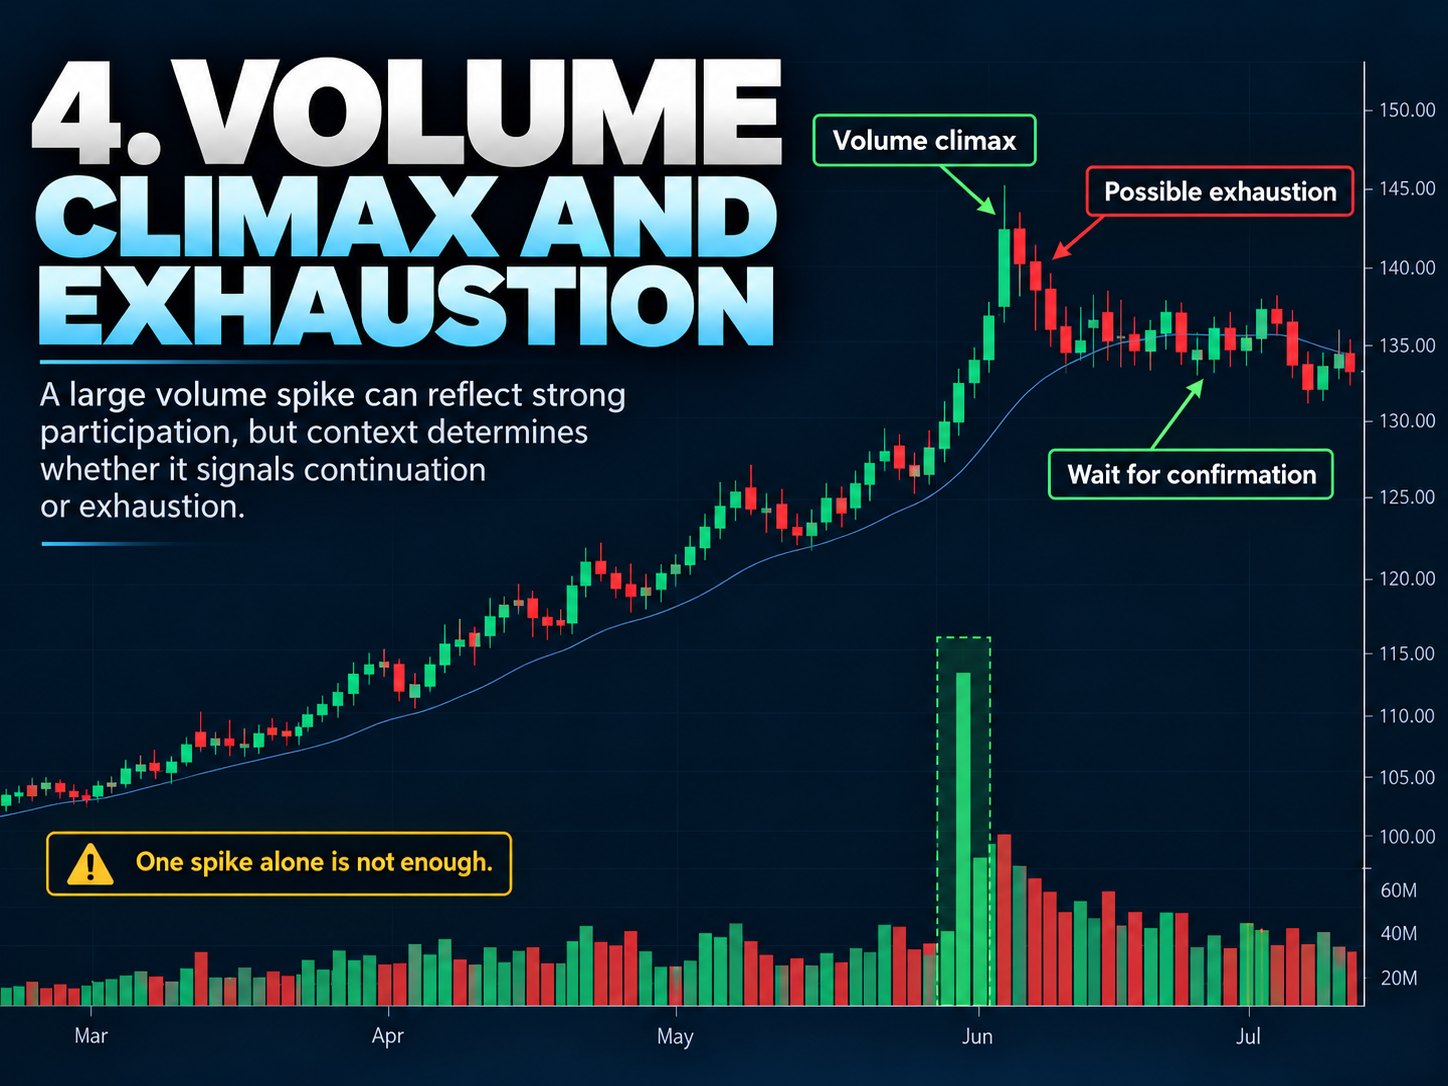
A volume climax refers to an unusually large concentration of trading activity, often associated with a sharp price movement.
Such events may occur during panic selling, aggressive buying, important news announcements, or periods of forced position liquidation.
A volume spike near the end of a prolonged trend sometimes coincides with exhaustion.
For example, a stock might rise rapidly, record its highest volume in several months, and then fail to sustain the breakout above a resistance level.
The volume spike indicates unusually strong participation, but the subsequent price rejection provides the more relevant evidence of potential exhaustion.
A similar situation can develop near the bottom of a downtrend when intense selling activity is followed by a strong recovery.
Not every volume climax marks a reversal.
The same expansion in trading activity can occur at the beginning of a powerful new trend. Distinguishing between continuation and exhaustion requires examining the price response after the volume spike.
A useful approach is to compare where the session closes within its trading range, whether the price retains its movement, and how the next several candles behave.
Which Volume Indicators Are Worth Understanding?
Standard volume bars provide a starting point, but several indicators organize volume information differently.
On-Balance Volume (OBV) adds or subtracts volume based on whether the closing price is higher or lower than the previous close. It creates a cumulative series that traders can compare with price trends.
Volume Weighted Average Price (VWAP) represents an average traded price weighted by volume over a defined calculation period, commonly a trading session. It helps traders assess where trading has occurred relative to the volume-weighted average.
Volume Profile distributes traded volume across price levels rather than time intervals. This makes it useful for identifying areas of substantial historical trading activity, including high-volume and low-volume price zones.
These tools answer different questions.
Standard volume shows how much activity occurred during a candle. OBV tracks cumulative volume associated with closing-price direction. VWAP provides a volume-weighted price reference. Volume Profile shows where trading activity was concentrated across prices.
Choosing between them depends on what the trader is trying to evaluate. Adding multiple volume indicators without understanding their differences can create more confusion than useful confirmation.
Why Volume Data May Differ Between Markets and Platforms
A volume reading is only as useful as the market data behind it.
In centralized stock exchanges, trading volume generally represents executed transactions reported through the relevant market data systems. Depending on the data feed, exchange coverage and reporting rules can affect what a platform displays.
In cryptocurrency markets, trading takes place across multiple exchanges. A BTC/USDT chart from one exchange normally reflects that exchange’s reported activity, not necessarily the combined volume of every cryptocurrency trading venue.
Spot and derivatives markets also have different trading structures. Futures contract volume should not be directly compared with spot asset volume without accounting for the measurement units and market conditions.
Decentralized forex trading introduces another distinction. Many forex platforms provide tick volume, which measures price updates or quote changes rather than the total volume of transactions across the entire global market.
For cross-market comparisons, traders should identify the data source, measurement unit, trading session, and whether the volume is consolidated or limited to a particular venue.
Common Mistakes When Interpreting Trading Volume
One common mistake is assuming that high volume always indicates strong buying pressure.
High volume reflects elevated transaction activity. Determining whether buyers or sellers are gaining control requires additional information from price behavior and, when available, more detailed order-flow data.
Another mistake is comparing volume across different assets without considering their usual liquidity.
A third is focusing only on one unusually large bar while ignoring previous trading sessions.
Volume readings also become misleading when the timeframe is changed without adjusting the interpretation. A five-minute volume spike and a weekly volume expansion describe different market conditions.
Finally, volume indicators should not replace risk management. A high-volume breakout can fail, and a low-volume advance can continue much longer than expected.
A Practical Framework for Reading Volume
When reviewing a trading chart, begin with the price structure rather than the volume bars.
First, identify whether the market is trending upward, trending downward, or moving sideways.
Then compare recent volume with its historical average. Determine whether trading activity is expanding, contracting, or remaining relatively stable.
Next, examine volume at meaningful technical locations: established support and resistance, previous swing highs and lows, consolidation boundaries, or major breakout levels.
Consider how price responds after unusually high-volume sessions. Holding the gains, rejecting a breakout, or quickly reclaiming a broken support level can each carry different implications.
The objective is not to find one perfect volume pattern. It is to build a consistent interpretation of participation and price behavior before making a trading decision.
Frequently Asked Questions About Trading Volume
Is high trading volume bullish or bearish?
High volume is not inherently bullish or bearish. It indicates greater trading activity. Price direction, market structure, candle behavior, and the surrounding context determine how that activity should be interpreted.
Can a stock rise with low volume?
Yes. Price can rise even when trading volume is relatively low. Limited available selling liquidity may allow prices to move higher without substantial total transaction volume.
What is considered good trading volume?
There is no universal volume level that applies to every asset. Volume becomes more meaningful when compared with the asset’s historical activity, liquidity, and relevant trading session.
Does increasing volume confirm an uptrend?
Increasing volume during rising prices can support an uptrend by indicating expanding market participation. However, it is not definitive confirmation and cannot guarantee continued price appreciation.
What does declining volume during a pullback mean?
Declining volume during a pullback may indicate reduced trading participation compared with the preceding trend. The interpretation depends on the trend structure, nearby support levels, and subsequent price action.
Is volume more useful than RSI or MACD?
The indicators measure different aspects of the market. Volume describes trading activity, RSI evaluates price momentum, and MACD examines relationships between moving averages. They can complement one another, but none is universally superior.
Final Thoughts: What Volume Can and Cannot Tell You
Trading volume is most useful when it answers a specific question about market participation.
Is a developing trend attracting increasing activity? Did a breakout occur with unusually strong trading? Are prices establishing new highs while participation weakens? Did a large volume spike result in sustained movement or immediate rejection?
These questions are more informative than treating every high-volume candle as a buy signal or every decline in volume as a warning.
The strongest volume analysis comes from combining participation data with price structure, meaningful technical levels, and a defined risk-management plan. Volume adds context to trading decisions, but it cannot establish future price direction on its own.