
Accumulation Distribution Indicator: How to Read the A/D Line
A stock can continue making higher highs even as the volume behind its price movement becomes less convincing. In other situations, prices remain under pressure while an indicator based on trading volume begins moving higher. These differences can raise questions about whether the current trend has enough participation to continue.
The Accumulation Distribution Indicator, commonly called the A/D Line or ADL, helps traders examine these situations by combining trading volume with the location of each candle’s closing price.
Unlike indicators that focus only on price direction, the A/D Line estimates buying and selling pressure from where an asset closes within its trading range. Comparing the indicator with price action may help identify trend confirmation, potential divergences, and changes in market participation.
However, a rising A/D Line does not prove that institutional investors are accumulating an asset, nor does a falling line guarantee a bearish reversal. Understanding what the calculation measures—and what it overlooks—is essential before using it in a trading strategy.
What Is the Accumulation Distribution Indicator?
The Accumulation Distribution Indicator is a cumulative, volume-based technical indicator developed by Marc Chaikin. It attempts to evaluate buying and selling pressure by examining the closing price relative to the highest and lowest prices of each trading period.
The indicator operates on a straightforward principle: a close near the top of a candle’s range is treated as evidence of positive money-flow pressure, while a close near the bottom is treated as negative money-flow pressure.
Trading volume determines how much that period contributes to the cumulative line.
For example, a candle that closes near its high on unusually large volume can produce a substantial increase in the A/D Line. A candle closing near its low on similarly high volume can produce a substantial decrease.
The indicator is normally displayed as a line beneath the price chart.
Rather than interpreting its absolute numerical value, traders generally examine its direction, swing highs and lows, and relationship with the underlying price movement.
How Is the Accumulation Distribution Line Calculated?
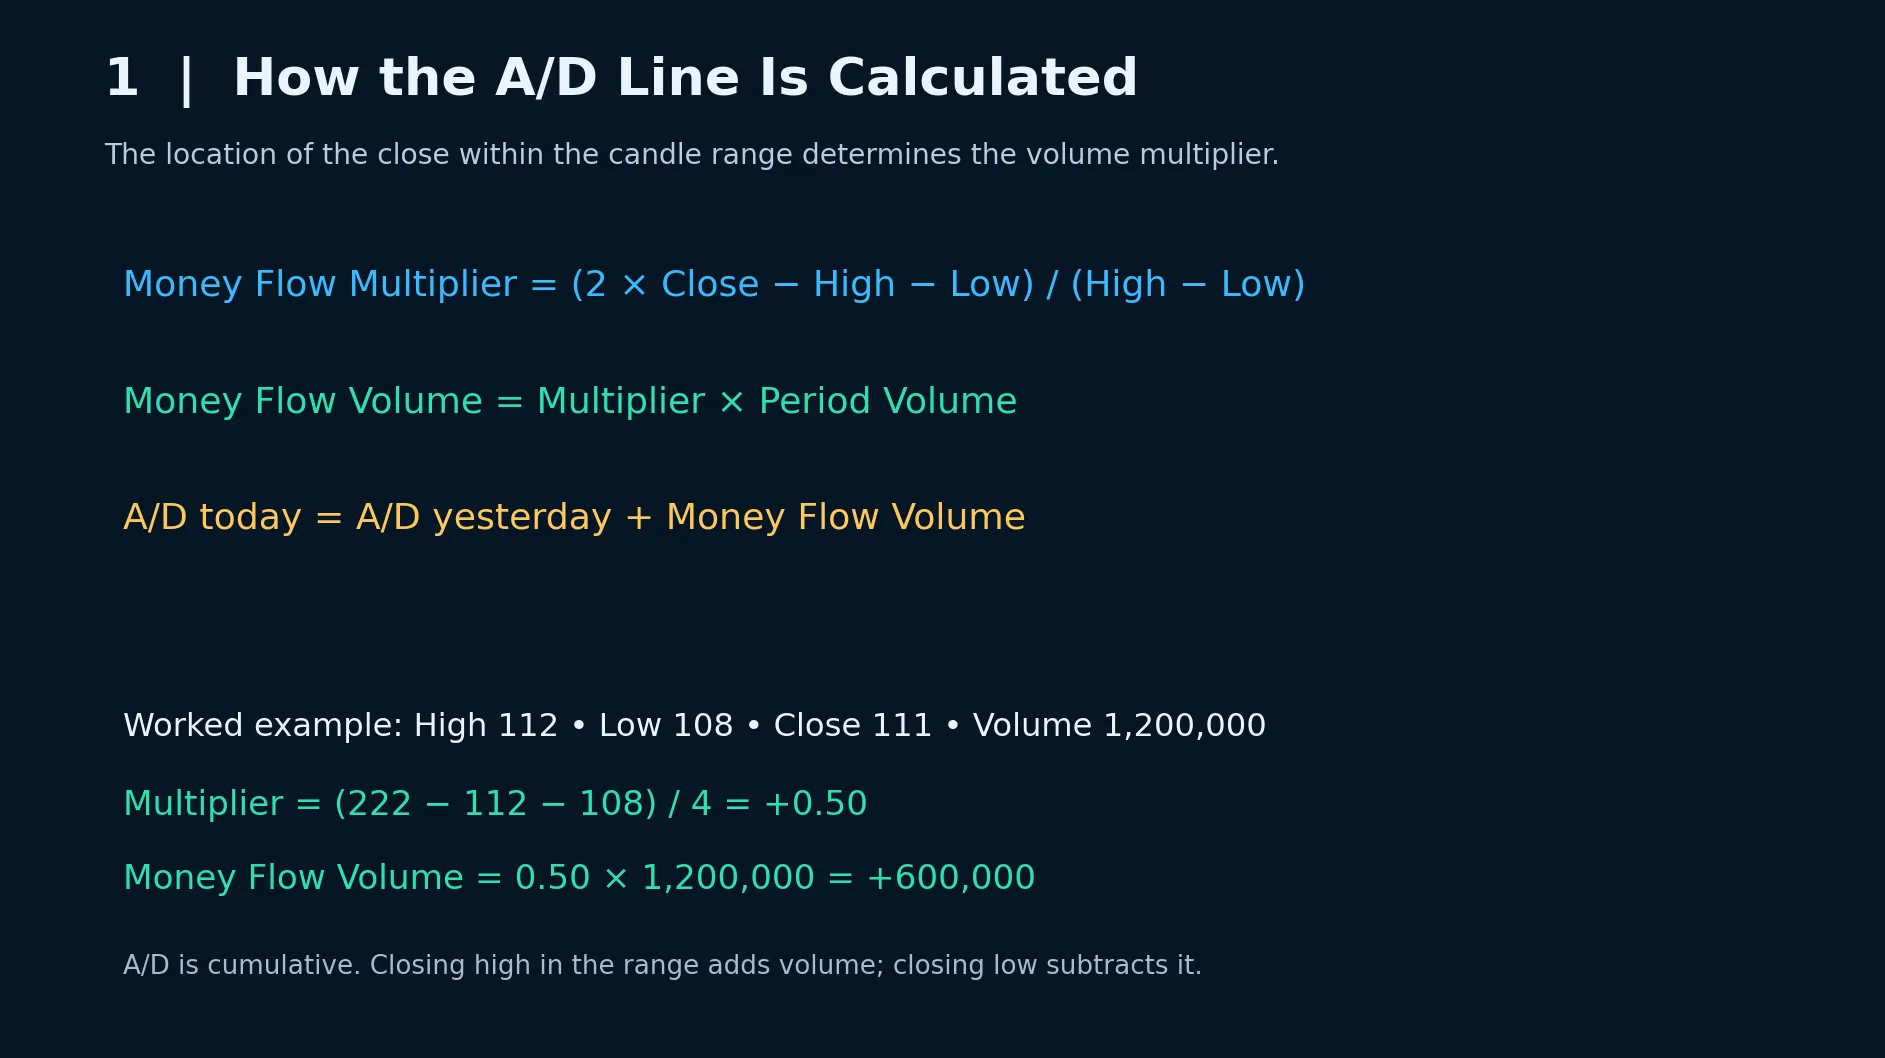
The A/D Line calculation uses three steps: determining the Money Flow Multiplier, multiplying it by volume, and adding the result to the previous A/D value.
Step 1: Calculate the Money Flow Multiplier
The Money Flow Multiplier measures where the closing price falls within the candle’s high-low range.
Money Flow Multiplier = [(Close − Low) − (High − Close)] / (High − Low)
The result ranges from -1 to +1.
A value near +1 means the price closed close to the high of the period. A value near -1 means it closed near the low. A value near zero means the closing price was approximately in the middle of the range.
If the high and low are equal, the normal formula cannot be applied because the denominator is zero. Charting platforms typically handle this condition separately rather than dividing by zero.
Step 2: Calculate Money Flow Volume
The multiplier is then combined with the period’s trading volume.
Money Flow Volume = Money Flow Multiplier × Volume
A positive result contributes to an increase in the A/D Line, while a negative result reduces it.
Step 3: Update the A/D Line
Current A/D = Previous A/D + Current Money Flow Volume
Because each new value is added to the previous total, the indicator is cumulative.
A Practical Calculation Example
Consider a stock with the following daily data:
| Measurement | Value |
|---|---|
| High | $112 |
| Low | $108 |
| Close | $111 |
| Trading Volume | 1,200,000 shares |
The Money Flow Multiplier is:
[(111 − 108) − (112 − 111)] / (112 − 108) = 0.50
Multiplying the result by volume:
0.50 × 1,200,000 = +600,000
The A/D Line increases by 600,000 units for that session.
Now consider a different session where the stock closes near the bottom of its trading range. The multiplier would be negative, subtracting the corresponding Money Flow Volume from the cumulative total.
This explains why the A/D Line can increase even when a stock finishes below its previous closing price. The indicator primarily measures the position of the current close within the current high-low range, not the change between consecutive closing prices.
What Does a Rising or Falling A/D Line Mean?
A rising A/D Line indicates that positive Money Flow Volume has been accumulating over the periods being examined.
This suggests that prices have frequently closed in the upper portions of their trading ranges, weighted by volume.
A falling A/D Line indicates the opposite: negative Money Flow Volume has dominated the cumulative calculation.
These movements can help traders evaluate whether the participation reflected by the indicator supports or contradicts the prevailing price trend.
Rising A/D Line During an Uptrend
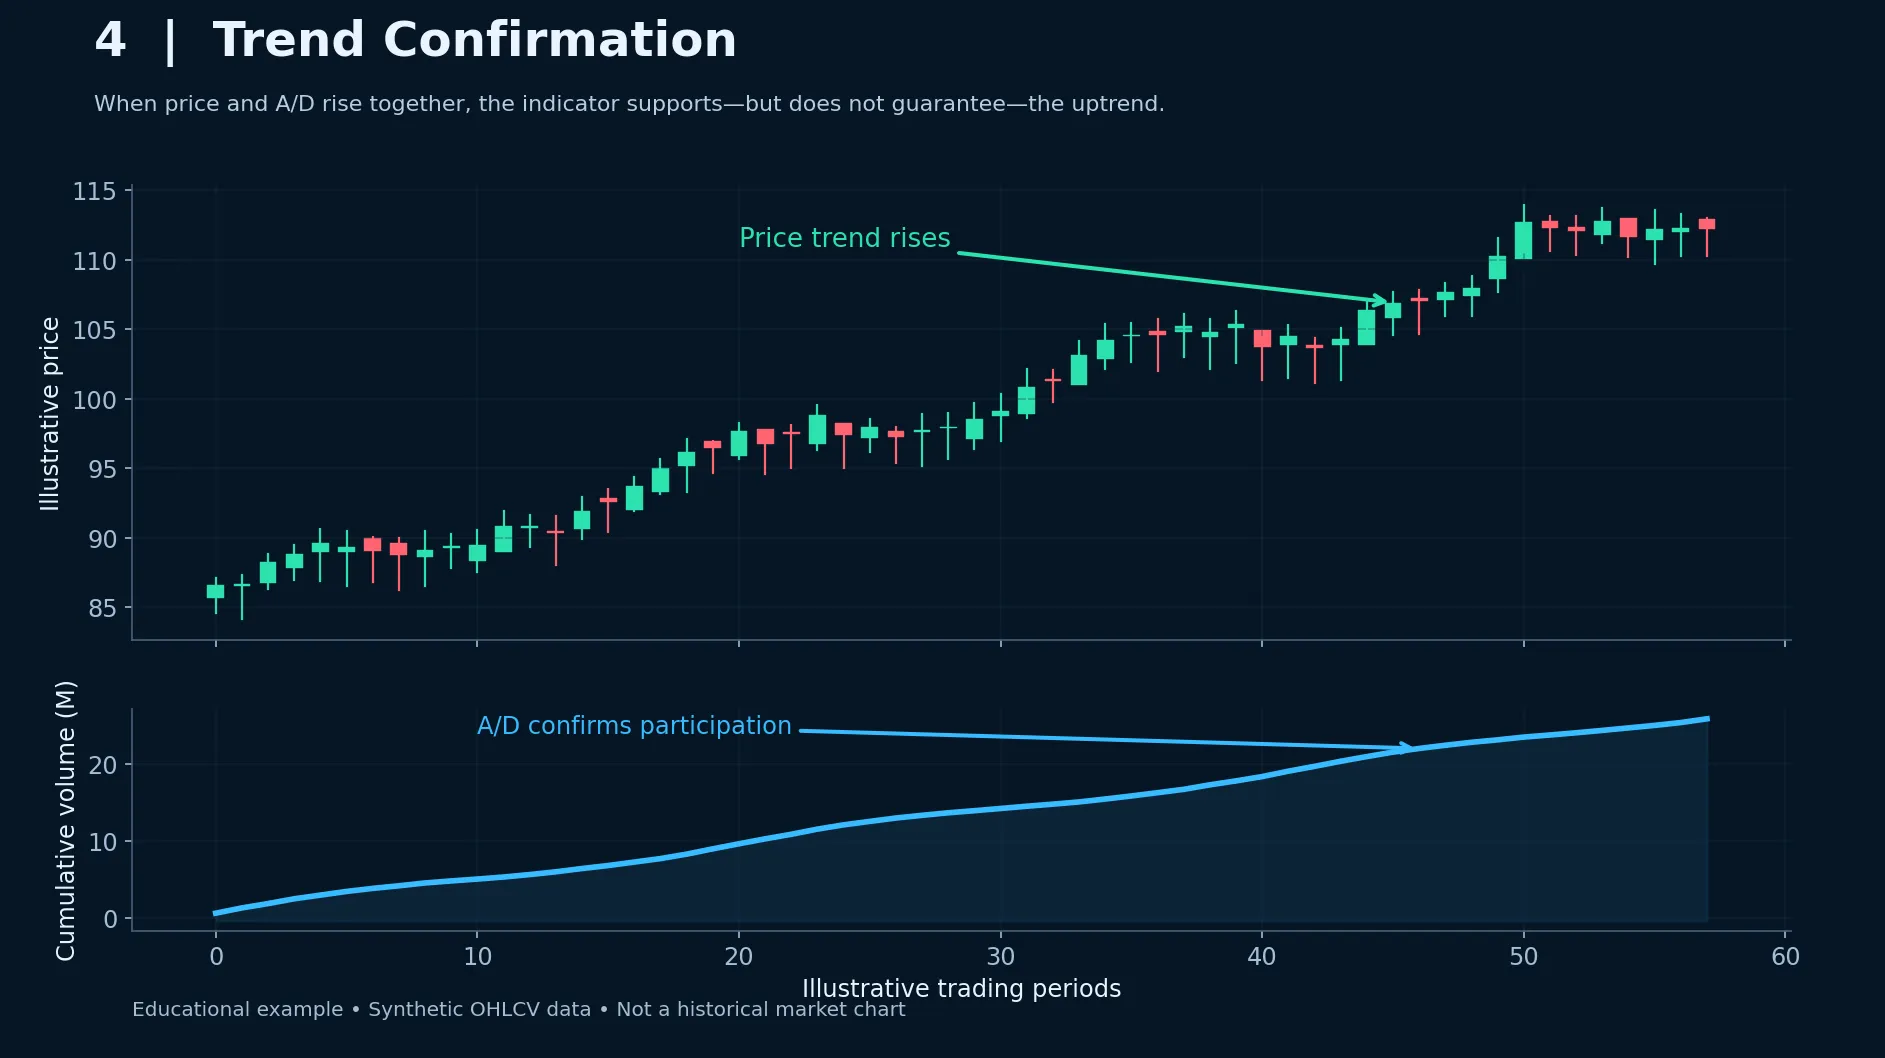
When both price and the A/D Line move higher, the indicator generally confirms the upward trend.
Suppose a stock advances from $80 to $100 while its A/D Line steadily establishes higher highs and higher lows.
The relationship suggests that the advancing price structure is accompanied by repeated positive money-flow readings.
This is stronger evidence of alignment than a price advance accompanied by a consistently declining A/D Line.
Nevertheless, confirmation does not mean that the asset is undervalued or that its upward movement must continue.
Falling A/D Line During a Downtrend
If price establishes lower highs and lower lows while the A/D Line also moves downward, the two series are aligned in a bearish direction.
The declining indicator suggests that negative money-flow readings have accumulated throughout the period.
This can support the interpretation of sustained selling pressure, although the underlying market structure remains the primary reference for judging the trend.
When Price and A/D Move in Different Directions
Divergence occurs when the indicator fails to confirm an important price movement.
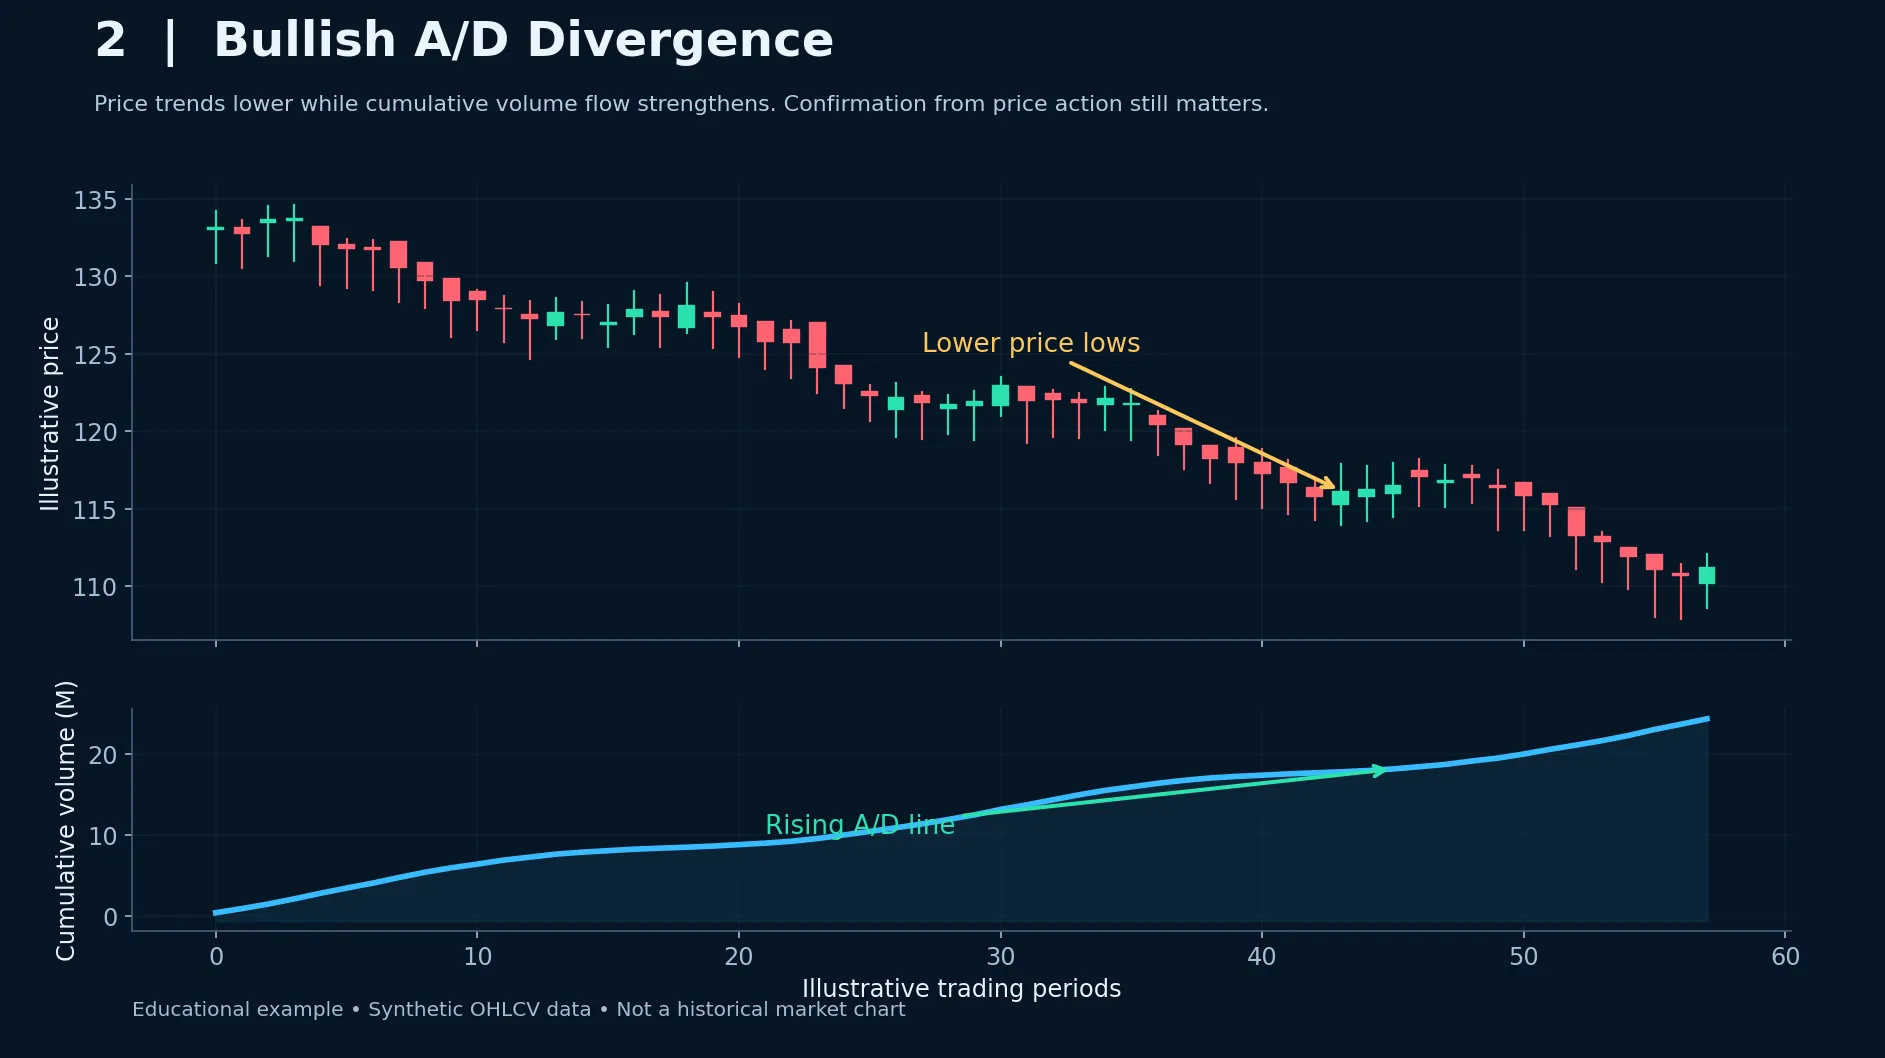
For instance, price might establish a lower low while the A/D Line creates a higher low.
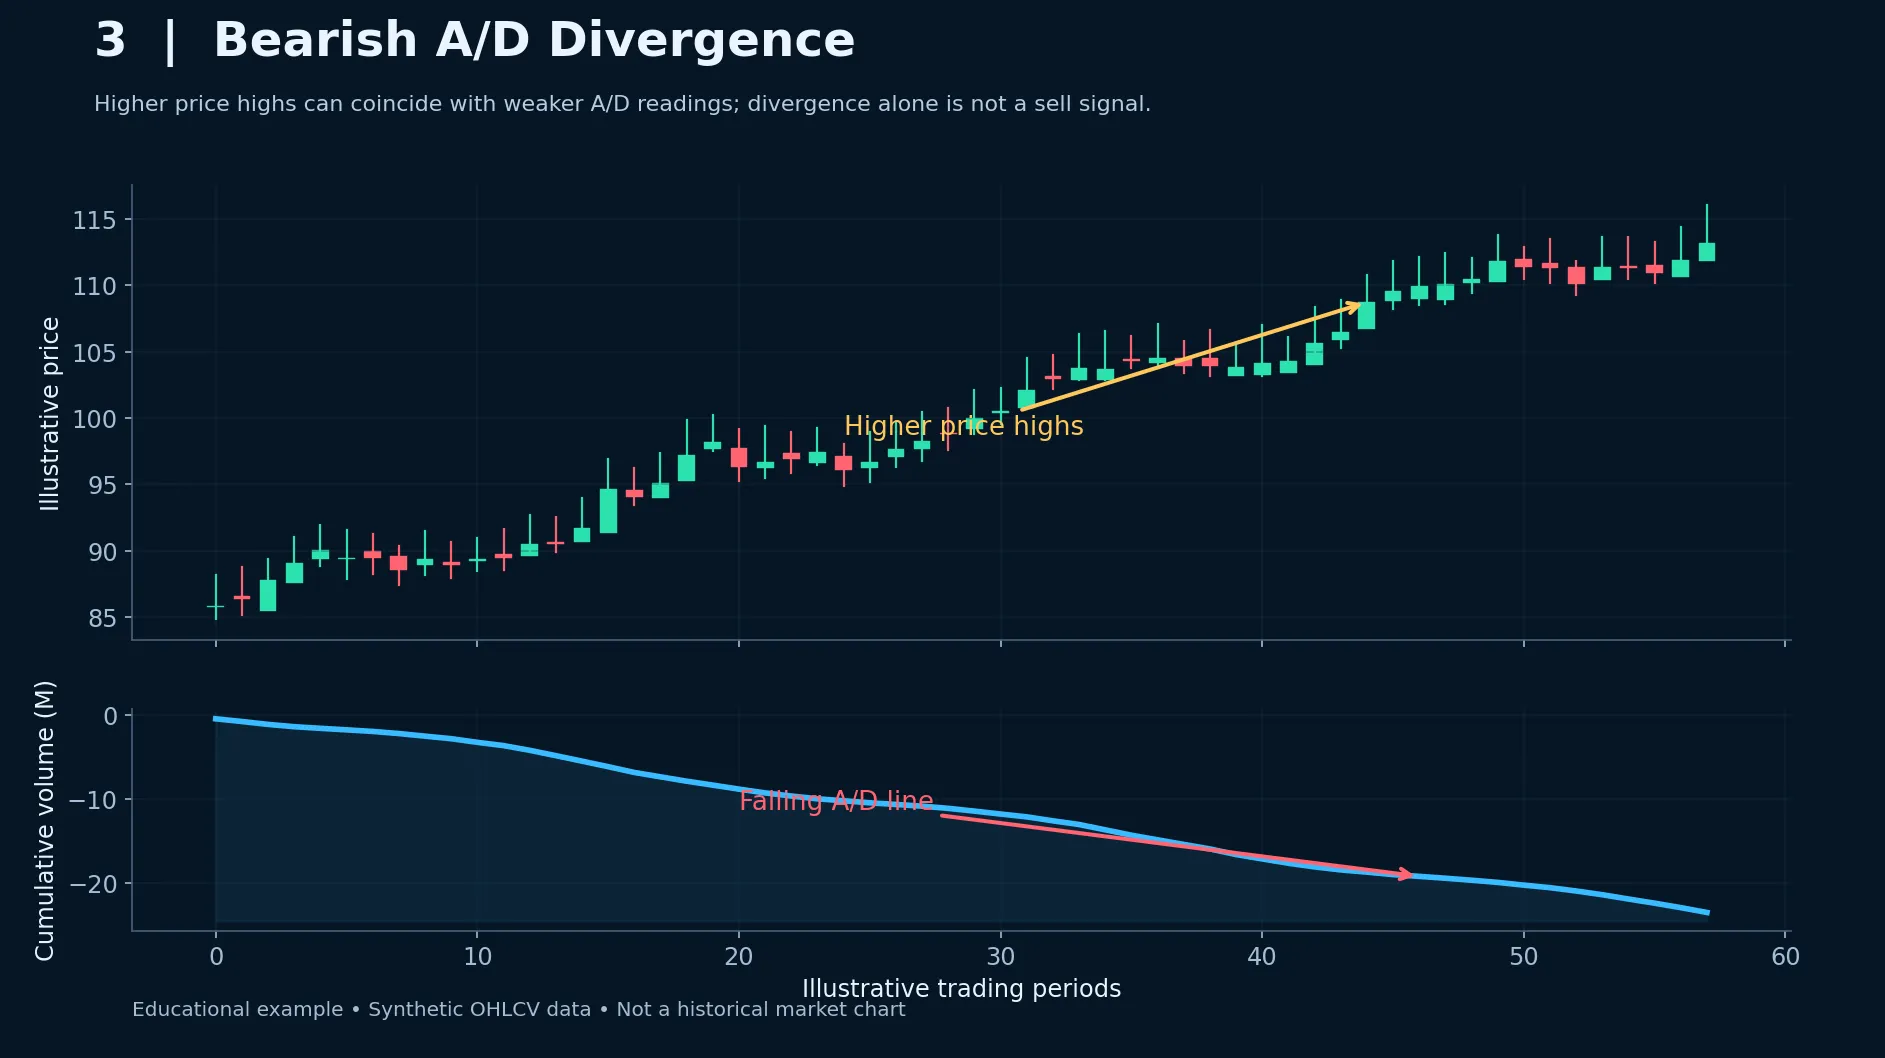
Alternatively, price may reach a new high even as the A/D Line fails to exceed its previous high.
These disagreements can suggest a change in the character of trading activity.
They are warnings worth investigating rather than independent entry or exit signals.
How to Identify Bullish A/D Divergence
Bullish A/D divergence develops when price forms a lower low while the Accumulation Distribution Line establishes a higher low.
This means the asset has reached a weaker price level, but the cumulative money-flow calculation has not deteriorated to the same extent.
Consider a stock that declines from $65 to $48 and subsequently rebounds toward $54. A second decline pushes the price to $45, creating a new low.
If the A/D Line forms a higher low during that second decline, the indicator is not confirming the latest price weakness.
The divergence may suggest that the structure of closing prices and volume has changed, even while the market continues to trade lower.
However, a higher A/D low does not guarantee that selling has finished.
A trader might wait for price to reclaim a nearby resistance level, establish a higher swing low, or demonstrate another meaningful improvement in market structure.
Why Bullish Divergence Can Fail
A declining market can produce several bullish divergences before a genuine recovery begins.
This is particularly relevant during prolonged downtrends, where temporary improvement in money flow does not necessarily overcome the broader bearish structure.
Price gaps and unusual candles can also distort the relationship between price and the A/D Line.
For that reason, a bullish divergence becomes more useful when it is supported by price confirmation rather than used as a reason to buy immediately.
How to Identify Bearish A/D Divergence
Bearish A/D divergence occurs when price creates a higher high while the indicator forms a lower high.
Imagine a stock reaching $120, pulling back, and then advancing to $128.
The new price high shows that the market has extended its upward movement. However, if the A/D Line remains below its previous peak, the indicator is no longer confirming that advance.
This may indicate weaker cumulative money-flow readings during the latest rally.
It does not necessarily mean that institutions are selling shares or that a downward reversal is imminent.
A useful next step is to evaluate the surrounding price structure.
Has price reached a major resistance area? Is the latest breakout holding? Have short-term support levels begun to fail?
Bearish divergence becomes more meaningful when accompanied by observable deterioration in price behavior.
Divergence Is Not a Timing Indicator
A market can remain overextended or exhibit declining momentum for considerable periods before reversing.
The same limitation applies to A/D divergence.
The appearance of divergence provides a reason to reassess an existing trend, not a precise prediction of when that trend will end.
Can the A/D Line Confirm a Breakout?
The A/D Line can provide additional context when price breaks above resistance or below support.
Consider a stock that has traded between $90 and $105 for several weeks.
Price eventually closes above $105, while the A/D Line simultaneously establishes a new high.
This alignment suggests that positive money-flow readings have accompanied the breakout.
The signal may be more convincing than a breakout occurring while the A/D Line continues to establish lower highs.
However, breakout confirmation should not rely entirely on the indicator.
The closing price beyond resistance, trading volume, subsequent price behavior, and available room before the next major resistance area remain relevant.
A breakout can still fail even when the A/D Line initially confirms the move.
What If A/D Rises Before Price Breaks Out?
The indicator can sometimes improve while price remains inside a consolidation range.
This may indicate that candles are frequently closing toward the upper ends of their ranges, producing positive money-flow readings without an immediate price breakout.
Such behavior can attract attention to a developing setup.
Nevertheless, the indicator cannot establish whether the range will resolve upward or how long consolidation will continue.
Traders can use the A/D Line to identify a potential discrepancy while waiting for price to confirm the next meaningful move.
Accumulation Distribution vs. On-Balance Volume: What’s the Difference?
Both the Accumulation Distribution Line and On-Balance Volume (OBV) use trading volume to evaluate market participation.
Their calculations, however, are fundamentally different.
OBV adds the period’s volume when the closing price is higher than the previous close and subtracts volume when the closing price is lower.
The A/D Line instead evaluates where the current close falls within the current period’s high-low range.
| Feature | A/D Line | OBV |
|---|---|---|
| Main input | Close relative to current high-low range | Current close relative to previous close |
| Volume contribution | Multiplied by a value from -1 to +1 | Added or subtracted in full |
| Cumulative | Yes | Yes |
| Sensitive to price gaps | Does not directly measure gaps | Responds to changes in closing prices |
| Typical use | Money-flow interpretation and divergence | Volume-based trend confirmation |
Consider a stock that gaps down sharply but then recovers to close near the high of its daily trading range.
OBV would decrease if the stock still closed below the previous session’s closing price.
The A/D Line could increase because the current candle closed near its high.
Neither indicator is necessarily calculating incorrectly. They are responding to different aspects of price behavior.
Understanding this difference prevents traders from treating contradictory readings as a technical malfunction.
Accumulation Distribution vs. Chaikin Money Flow
Chaikin Money Flow (CMF) is closely related to the A/D Line because both indicators use the same Money Flow Multiplier.
The difference lies in how their outputs are constructed.
The A/D Line continuously accumulates Money Flow Volume.
CMF calculates the sum of Money Flow Volume over a specified lookback period and divides it by the total volume over that period.
As a result, CMF is an oscillator that fluctuates above and below zero, while the A/D Line is a cumulative series without a fixed upper or lower boundary.
A trader looking to evaluate cumulative money-flow trends may prefer the A/D Line.
Someone interested in whether positive or negative money-flow readings have dominated a defined recent period may find CMF easier to interpret.
Neither indicator reveals the identities of market participants or the exact transactions executed by institutional investors.
Why the A/D Line Can Give Misleading Signals
The main limitation of the A/D Line comes from its calculation.
Because the Money Flow Multiplier uses the current candle’s high, low, and close, it does not directly measure the gap between the previous session’s close and the current session’s trading range.
This can create a significant disconnect.
Imagine a stock closes at $100 and opens the next session at $90 after unfavorable news. During the session, it trades between $89 and $94 before closing at $93.50.
Despite the substantial decline from the previous close, the stock finishes near the high of its intraday range.
The A/D Line may increase for that session because the Money Flow Multiplier is positive.
This does not mean the broader price decline was bullish. It means the indicator’s calculation classified the current candle’s closing location as positive.
Other limitations include differences in volume data across trading platforms, unusual activity around corporate events, and unreliable readings from illiquid markets.
A cumulative indicator can also retain the influence of historical periods, making its absolute value less informative than its trend and relative turning points.
How to Use the A/D Line in a Trading Strategy
An A/D-based strategy should begin with price structure rather than the indicator alone.
First, identify whether the asset is trending or consolidating. Established swing highs, swing lows, and meaningful support or resistance areas provide the structural context.
Next, examine whether the A/D Line confirms the trend.
If price and A/D are both establishing higher highs, the indicator supports the bullish interpretation.
If price makes higher highs while A/D weakens, the divergence may justify greater caution.
The next step is to define an actual price trigger.
For a bullish setup, this might involve a close above resistance after the A/D Line begins improving.
For a bearish setup, traders may look for a support breakdown after a period of weakening A/D readings.
Finally, the trade must have a defined invalidation level and position size.
For example, a planned long entry at $52 with a stop-loss at $49 creates $3 of risk per share.
With a maximum trade-risk budget of $300, the theoretical position size would be 100 shares before transaction costs and slippage.
The A/D Line helps evaluate market participation; it does not determine a suitable stop-loss or replace risk management.
Which Timeframe Works Best for Accumulation Distribution?
The A/D Line can be applied to intraday, daily, and weekly charts, provided meaningful volume data is available.
Daily charts are commonly useful for assessing changes in participation over several weeks or months.
Weekly charts can reduce the influence of individual sessions and help reveal broader money-flow trends.
Intraday charts provide more detailed information about activity within a trading session, although they can be influenced by opening and closing auctions, news events, and uneven trading activity.
The appropriate timeframe depends on the trading horizon.
A trader evaluating weekly market structure should not rely exclusively on a five-minute A/D divergence.
Likewise, a short-term trader may find that a weekly indicator responds too slowly for the intended setup.
Using a higher timeframe for context and a lower timeframe for execution can help keep the analysis consistent.
Common Mistakes When Using the A/D Indicator
One mistake is interpreting every increase in the A/D Line as proof of institutional accumulation.
The indicator does not identify who is trading. It estimates positive or negative money-flow pressure from candle structure and volume.
Another mistake is comparing absolute A/D values across unrelated assets. Because the indicator is cumulative and depends on volume, its numerical scale varies substantially.
A third mistake is entering trades immediately after identifying divergence, without waiting for price confirmation.
Traders also overlook market-data differences. A cryptocurrency A/D Line calculated using one exchange’s volume may differ from an indicator using aggregated volume across several venues.
Finally, the A/D Line should not be treated as an independent prediction system. It is a supporting analytical tool whose usefulness depends on the wider market context.
Frequently Asked Questions About the A/D Line
Is the Accumulation Distribution Indicator bullish or bearish?
The indicator is neither inherently bullish nor bearish. A rising A/D Line suggests positive cumulative money-flow readings, while a falling line indicates negative readings. Its interpretation depends on the relationship with price.
Can the A/D Line predict a trend reversal?
No indicator can reliably predict every reversal. A/D divergence may warn that the indicator no longer confirms price action, but additional evidence is needed before interpreting the setup as a potential trend change.
What does it mean when price rises but A/D falls?
This is a potential bearish divergence. Price is moving higher while cumulative money-flow readings weaken. The disagreement may warrant caution, although the uptrend can continue.
Is A/D better than OBV?
Neither is universally better. A/D focuses on the close within the current candle’s range, while OBV compares consecutive closing prices. Their different calculations can make them useful in different circumstances.
Does the A/D Line have overbought and oversold levels?
No. Unlike bounded oscillators such as RSI, the A/D Line has no fixed overbought or oversold thresholds. Traders generally interpret its direction, trend structure, and divergences.
Can the A/D Line be used in cryptocurrency trading?
Yes, provided suitable volume data is available. However, exchange-specific volume, differences between spot and derivatives markets, and variations in data coverage should be considered.
Final Thoughts: Use A/D to Question or Confirm Price Behavior
The Accumulation Distribution Line is most useful when it helps answer whether cumulative volume-flow readings support the prevailing price structure.
A rising A/D Line can reinforce an uptrend. A falling line can support a bearish interpretation. Divergences can identify situations where the indicator and price no longer agree.
None of these relationships guarantees the next market movement.
Before acting on an A/D signal, consider the relevant support and resistance levels, the quality of the available volume data, recent price behavior, and the conditions that would invalidate the trading idea.
Used this way, the Accumulation Distribution Indicator becomes a practical tool for evaluating market participation rather than a standalone buy-or-sell system.
