Trend lines are one of the simplest yet most powerful tools in technical analysis. Whether you are trading stocks, crypto, or forex, understanding how to draw and interpret trend lines can significantly improve your decision-making process. At their core, trend lines help visualize market direction and highlight key areas where price is likely to react.
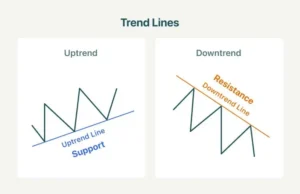
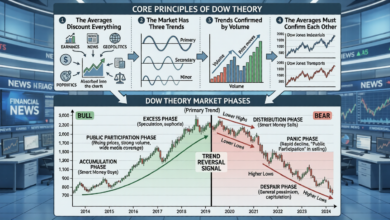
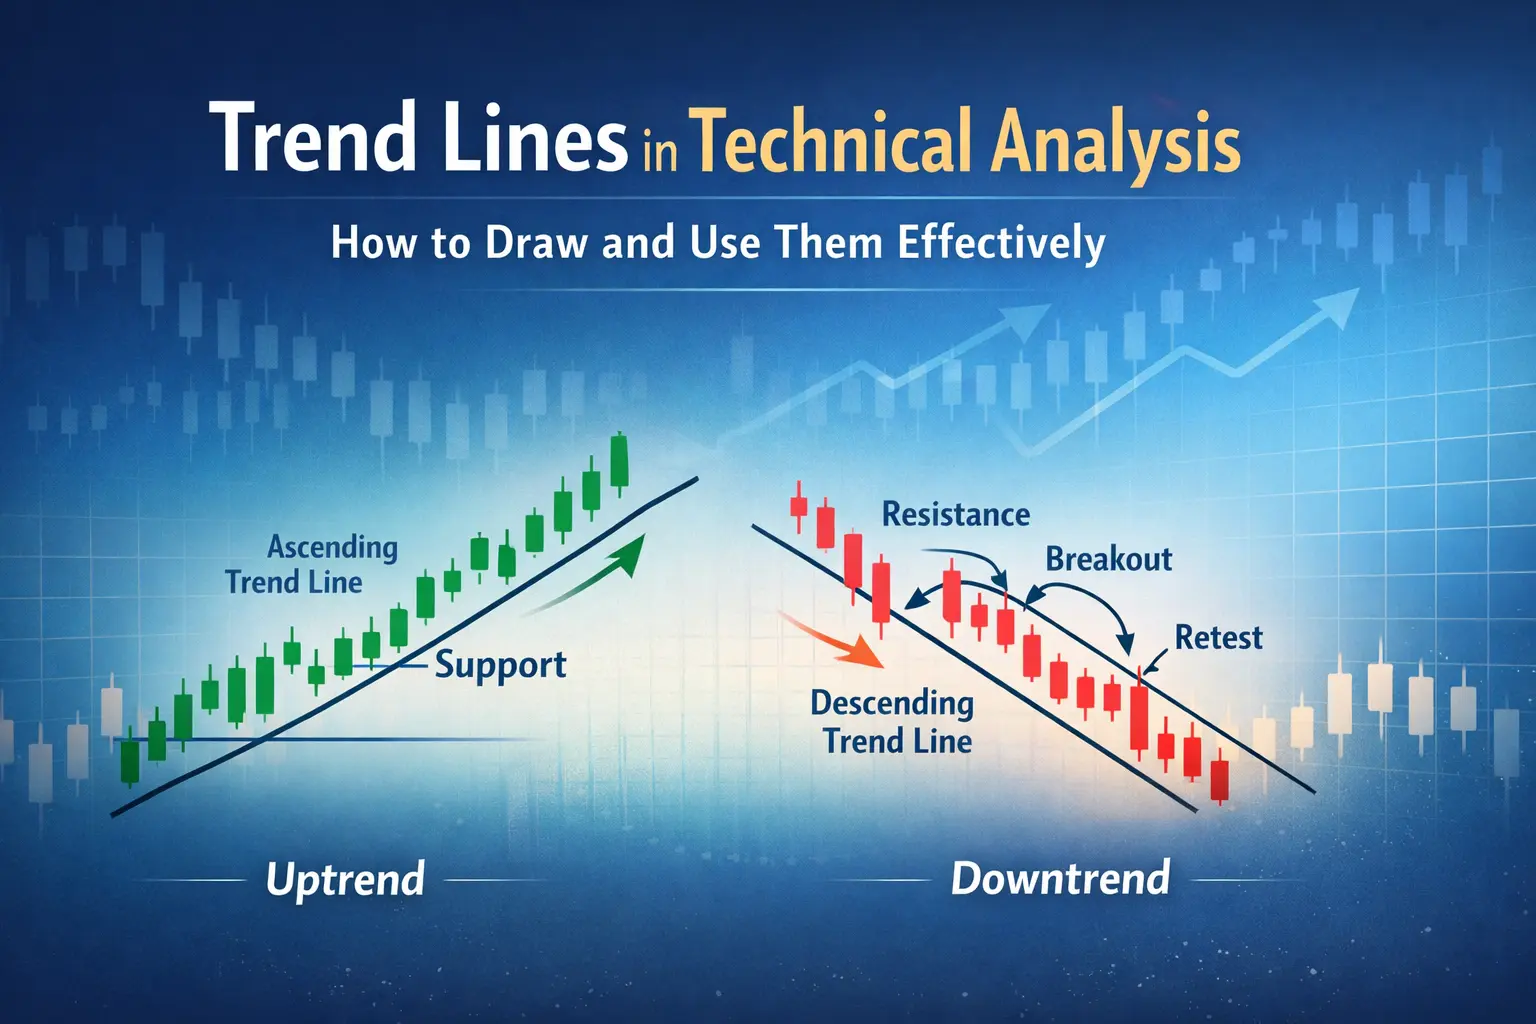
A trend line is essentially a straight line that connects two or more price points on a chart. In an uptrend, the line is drawn by connecting higher lows, while in a downtrend, it connects lower highs. This visual structure allows traders to quickly identify whether the market is moving upward, downward, or sideways.
What makes trend lines particularly valuable is their ability to act as dynamic support and resistance levels. In an uptrend, the trend line often behaves as a support level where price tends to bounce. In contrast, during a downtrend, the trend line acts as resistance, preventing price from moving higher. These reactions are not random—they reflect collective market psychology, where buyers and sellers repeatedly step in at similar levels.
Drawing an accurate trend line requires more than just connecting random points. The most reliable lines are formed when at least two significant touchpoints are respected by price, while a third touch adds confirmation. It’s important not to force a trend line to fit the chart. If the line doesn’t naturally align with price movements, it’s likely not valid.
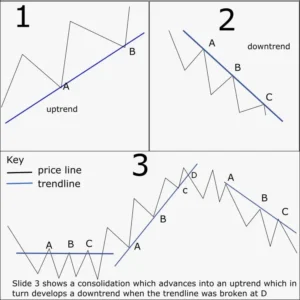
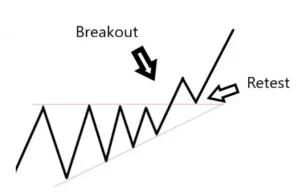
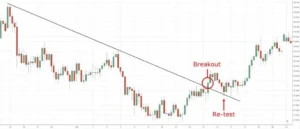
Another key aspect of using trend lines effectively is understanding breakouts. When price breaks a well-established trend line, it can signal a potential shift in market direction. However, not every breakout leads to a strong move. False breakouts are common, which is why experienced traders often wait for confirmation, such as a retest of the broken trend line or increased volume.
Trend lines can also be used in combination with other technical tools to increase accuracy. For example, when a trend line aligns with horizontal support or resistance, the level becomes significantly stronger. Similarly, combining trend lines with indicators like moving averages or RSI can help filter out weak signals and improve trade timing.
It’s also worth noting that trend lines are not static. As new price data forms, trend lines may need to be adjusted. Markets evolve, and a line that was once valid can lose its relevance over time. Flexibility is key—rigidly sticking to outdated lines can lead to poor trading decisions.
One common mistake among beginners is drawing too many trend lines on a chart. This often leads to confusion rather than clarity. A clean chart with one or two well-defined trend lines is far more effective than a cluttered one filled with unnecessary markings.
Ultimately, trend lines are about understanding structure. They provide a framework for analyzing price action and anticipating potential movements. While they are simple to learn, mastering them requires practice, patience, and a keen eye for market behavior.
When used correctly, trend lines can become a foundational tool in your trading strategy, helping you identify trends early, manage risk more effectively, and make more confident trading decisions.