Technical analysis is a method used to evaluate financial markets by analyzing price charts, patterns, and indicators. Instead of focusing on financial statements or economic data, technical analysis focuses entirely on price behavior and market psychology. For beginners, this approach can seem overwhelming at first, but once you understand how charts work and how trends form, the market becomes much easier to interpret. This guide explains the core concepts of technical analysis, including chart types, candlestick structure, trends, support and resistance, indicators, chart patterns, and risk management.
Technical analysis is based on the idea that all available information is already reflected in the price. Because of this, technical analysts believe that studying price movements is enough to make trading decisions. The goal is not to predict the future with certainty, but to identify probabilities and manage risk accordingly. When used correctly, technical analysis helps traders understand market structure, find trading opportunities, and improve timing for entries and exits.
Understanding How Price Charts Work
Price charts are the foundation of technical analysis because every indicator and pattern is built on price data. A chart shows how price moves over time, and this visual representation allows traders to identify trends, reversals, and important price levels. Without charts, technical analysis would not exist.
The most basic chart type is the line chart. A line chart connects closing prices over a period of time, which makes it very simple to read. This type of chart is useful for identifying the overall direction of the market, but it does not show detailed price action within each time period. Because of this limitation, most traders prefer more detailed chart types.

Bar charts provide more information because they show the open, high, low, and close prices for each time period. However, the most popular chart type in technical analysis is the candlestick chart. Candlestick charts display the same information as bar charts, but they present it in a more visual and readable way.
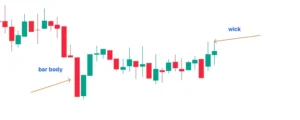
Each candlestick has two main parts called the body and the wicks. The body represents the distance between the open price and the close price. If the close price is higher than the open price, the candle is usually shown in green and represents buying pressure. If the close price is lower than the open price, the candle is usually shown in red and represents selling pressure.
The wicks, also called shadows, show the highest and lowest prices reached during that time period. Long upper wicks often indicate that price moved higher but was pushed back down by sellers. Long lower wicks often indicate that price moved lower but was pushed back up by buyers. This is why candlestick structure is important, because it shows the battle between buyers and sellers.
Understanding candle bodies and wicks helps traders read price action and understand market sentiment. Large candle bodies usually indicate strong momentum, while small bodies often indicate indecision in the market. Long wicks can signal rejection from support or resistance levels, which can be an early sign of a reversal.
Trend Direction and Market Structure
The trend is one of the most important concepts in technical analysis because markets do not move randomly. Instead, markets tend to move in trends, and these trends can last longer than most beginners expect. Learning how to identify the trend is one of the first skills every trader must develop.
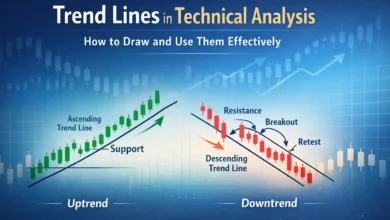
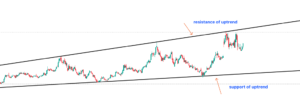
An uptrend occurs when the market forms higher highs and higher lows. This means that buyers are in control and price is generally moving upward. A downtrend occurs when the market forms lower highs and lower lows, which means sellers are in control and price is generally moving downward. A sideways market occurs when price moves between support and resistance without creating higher highs or lower lows.
Market structure is the way price forms highs and lows over time. By looking at market structure, traders can understand whether the market is trending or ranging. This helps traders decide whether they should look for buying opportunities, selling opportunities, or wait for a breakout.
Trading in the direction of the trend is important because it increases the probability of success. Many beginner traders try to catch the exact top or bottom of the market, but this is very difficult and risky. Professional traders usually trade with the trend because trends often continue longer than expected.
Support and Resistance Levels
Support and resistance are price levels where the market tends to react. These levels are formed because of supply and demand and also because traders remember previous price levels. Support is a level where price tends to stop falling and move upward, while resistance is a level where price tends to stop rising and move downward.
Support forms when buyers enter the market and prevent price from falling further. Resistance forms when sellers enter the market and prevent price from rising further. These levels are important because they often act as decision points in the market.
One important concept in technical analysis is role reversal. When price breaks above a resistance level, that level often becomes support. When price breaks below a support level, that level often becomes resistance. This happens because traders who missed the breakout often enter the market when price returns to that level.
Support and resistance levels are used to find entry points, stop-loss levels, and take-profit targets. Instead of entering trades randomly, traders wait for price to react at important levels. This approach improves risk management and makes trading more structured.
Using Technical Indicators Effectively
Technical indicators are mathematical calculations based on price and volume. They are used to confirm trends, measure momentum, and identify possible entry points. However, indicators should not be used alone because they are based on past price data and may lag behind the market.
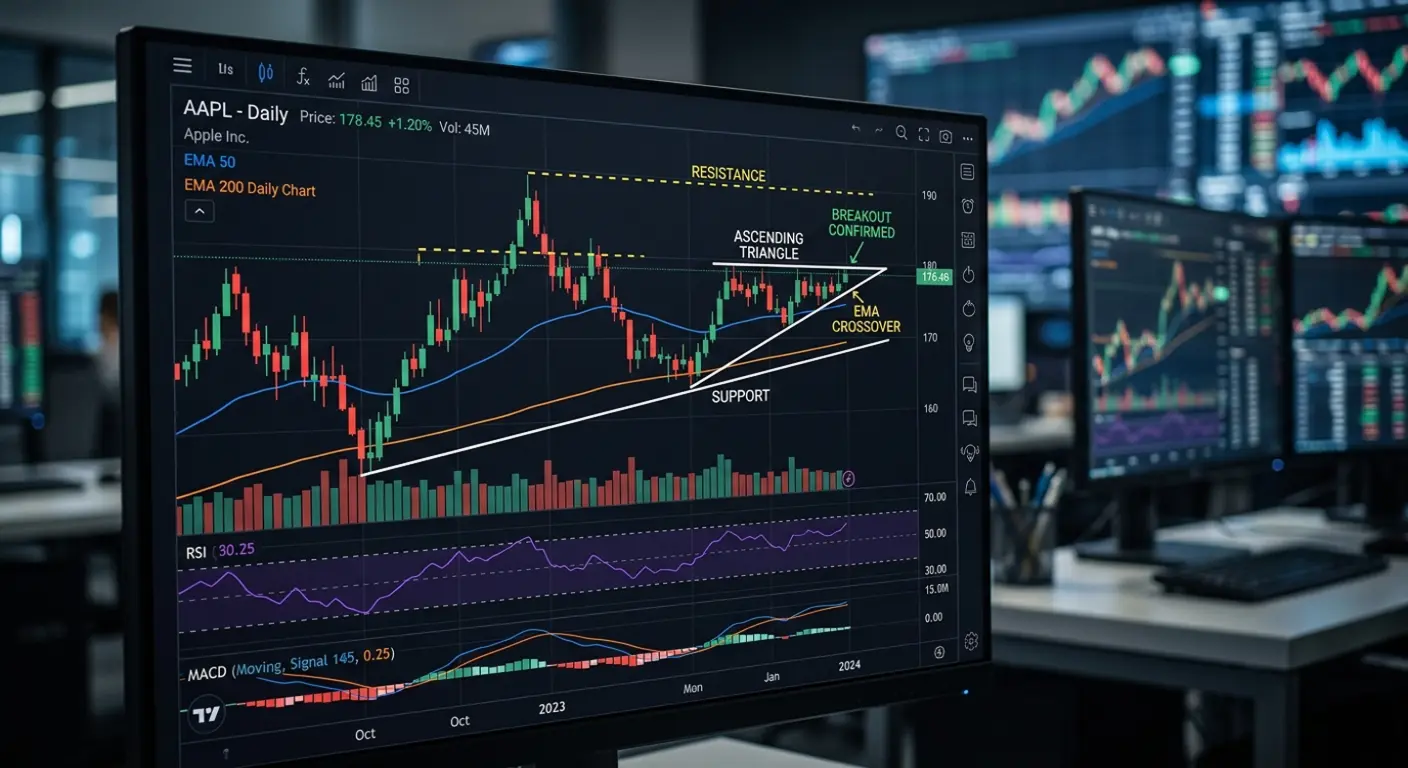
One of the most commonly used indicators is the moving average. Moving averages smooth out price movements and help traders identify the overall trend. When price is above a moving average, the market is generally considered to be in an uptrend. When price is below a moving average, the market is generally considered to be in a downtrend.
Momentum indicators such as the Relative Strength Index help traders understand whether the market is overbought or oversold. Overbought does not always mean price will fall immediately, and oversold does not always mean price will rise immediately. Instead, these conditions indicate that the market may be stretched and could be ready for a pullback or reversal.
Volume is another important indicator because it shows how strong a price movement is. If price moves up with high volume, the movement is considered strong. If price moves up with low volume, the movement may be weak and could reverse. Volume helps traders confirm breakouts and trend strength.
The most important rule when using indicators is that indicators should confirm what you see on the chart, not replace chart reading. Price action always comes first, and indicators come second.
Chart Patterns and Price Behavior
Chart patterns are formations that appear on charts and repeat over time because market psychology does not change. These patterns help traders anticipate possible future price movements based on past behavior.
Reversal patterns usually form after a strong trend and indicate that the market direction may change. These patterns show that the current trend is losing strength and that the opposite side may take control. Reversal patterns are often seen near strong support or resistance levels.
Continuation patterns usually form during a trend and indicate that the market may continue moving in the same direction after a short pause. These patterns represent consolidation, which means the market is taking a break before continuing the trend.
Chart patterns should not be used alone. The best approach is to combine chart patterns with support and resistance, trend analysis, and volume. When multiple factors support the same idea, the probability of success increases.
Risk Management and Trading Discipline
Many beginners focus too much on indicators and patterns but ignore risk management. In reality, risk management is what determines long-term success in trading. Even a good strategy will fail if risk is not controlled properly.
Risk management means controlling how much money you risk on each trade. Professional traders usually risk a small percentage of their account on each trade. This allows them to survive losing trades and continue trading.
Using a stop-loss is one of the most important parts of risk management. A stop-loss automatically closes a trade when price reaches a certain level. This prevents small losses from becoming very large losses. Take-profit levels are also important because they help traders lock in profits instead of holding trades too long.
Trading discipline is just as important as strategy. Many traders lose money not because their strategy is bad, but because they do not follow their own rules. Emotional trading, overtrading, and revenge trading are common mistakes among beginners.