What Is RSI? How to Use the Relative Strength Index in Trading
What Is the RSI Indicator?
The RSI indicator, short for Relative Strength Index, is one of the most widely used momentum indicators in technical analysis. Developed to measure the speed and magnitude of price movements, RSI helps traders identify potential trend reversals, overbought conditions, and oversold opportunities.
If you’re wondering what is RSI and why traders rely on it across stocks, forex, and cryptocurrency markets, the answer is simple: RSI measures the strength of price momentum and highlights when an asset may be moving too far in one direction.
As a momentum oscillator RSI, it fluctuates between 0 and 100, providing valuable insight into market sentiment and potential trading opportunities.
J. Welles Wilder and the History of RSI
The Relative Strength Index was created by J. Welles Wilder Jr. and introduced in his 1978 book New Concepts in Technical Trading Systems. Often referred to as the Welles Wilder RSI, the indicator quickly became a staple tool among traders worldwide.
Wilder designed RSI to evaluate price momentum strength by comparing recent gains and losses over a specified period. His innovative Wilder smoothing method remains part of the RSI calculation today.
How Is RSI Calculated?
The RSI calculation is based on the relationship between average gains and average losses over a selected timeframe.
Average Gain, Average Loss and the RSI Formula
The RSI formula is:
RSI = 100 − (100 / (1 + RS))
Where:
RS = Average Gain ÷ Average Loss
The calculation uses:
- Average gain during the selected period
- Average loss during the selected period
- Wilder’s smoothing technique
By analyzing average gain average loss, RSI determines whether bullish or bearish momentum is dominating the market.
Why Is 14 Periods the Standard Setting?
The most common setting is the RSI 14 period.
Wilder originally recommended 14 periods because it provides a balanced view of market momentum without being too sensitive or too slow.
Benefits of the 14-period RSI include:
- Reliable momentum signals
- Reduced market noise
- Suitable for most trading styles
- Widely accepted among traders
While 14 remains the default, many traders adjust RSI settings depending on their strategy and timeframe.
RSI Levels and How to Interpret Them
One of the most useful features of RSI is its ability to identify RSI overbought oversold conditions.
Above 70: Overbought Zone
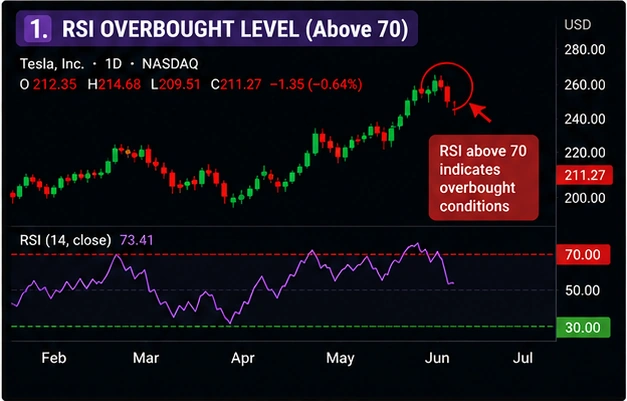
When RSI rises above 70, the market enters the RSI 70 30 levels overbought zone.
This may indicate:
- Strong bullish momentum
- Potential profit-taking activity
- Increased risk of a pullback
However, overbought conditions do not automatically signal a market reversal. Assets can remain overbought during strong uptrends.
Below 30: Oversold Zone
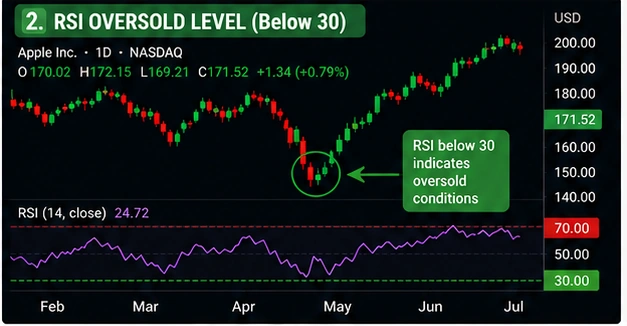
When RSI falls below 30, it enters the oversold zone.
This often suggests:
- Strong selling pressure
- Weak market sentiment
- Possible rebound opportunities
Many traders look for oversold readings as part of an RSI buy sell signal strategy.
The 50 Centerline: What It Signals
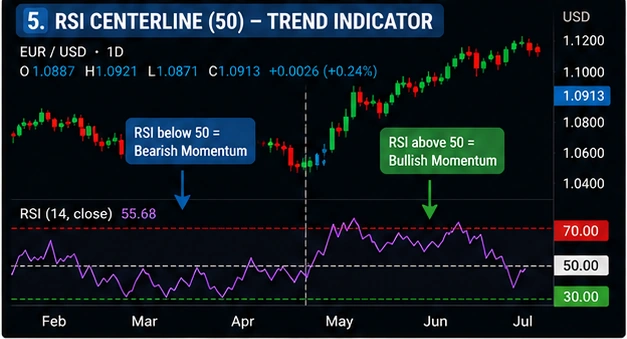
The RSI centerline 50 is often overlooked but provides valuable trend information.
- RSI above 50 suggests bullish momentum
- RSI below 50 suggests bearish momentum
Many traders use the centerline as a trend confirmation tool rather than focusing solely on overbought and oversold levels.
RSI Divergence Strategy
One of the most powerful uses of RSI involves identifying divergence between price and momentum.
How to Spot Bullish Divergence
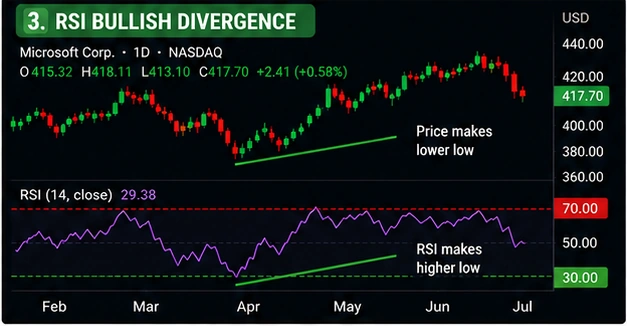
A bullish divergence RSI occurs when:
- Price forms a lower low
- RSI forms a higher low
This suggests that selling momentum is weakening, even though price continues to decline.
Bullish divergence often appears before upward reversals.
How to Spot Bearish Divergence
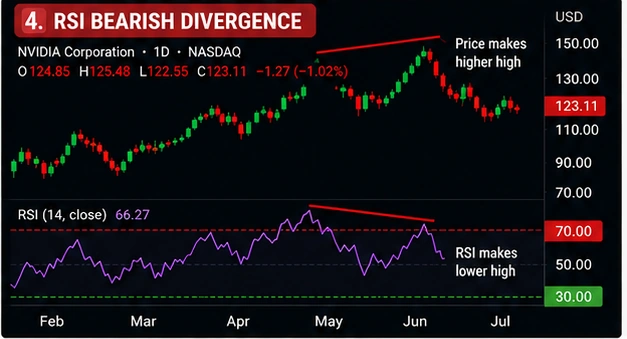
A bearish divergence RSI occurs when:
- Price forms a higher high
- RSI forms a lower high
This indicates weakening buying pressure and may signal a potential trend reversal.
Many professional traders consider divergence among the strongest RSI-based signals.
RSI Period Settings: 9, 14 and 21 Compared
Different trading styles may require different RSI settings.
RSI 9
- Faster signals
- Higher sensitivity
- Popular among day traders
RSI 14
- Standard setting
- Balanced performance
- Suitable for most markets
RSI 21
- Smoother signals
- Less market noise
- Better for long-term trend analysis
Choosing the best RSI period settings depends on your timeframe, risk tolerance, and trading objectives.
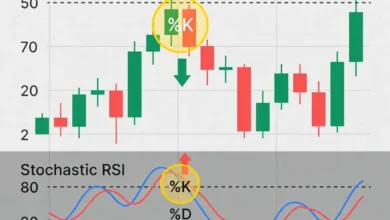
Combining RSI with MACD and Stochastic
Many traders compare RSI vs MACD and RSI vs stochastic when building a trading strategy.
Each indicator provides unique information:
| Indicator | Primary Purpose |
|---|---|
| RSI | Momentum strength |
| MACD | Trend and momentum |
| Stochastic | Price position within range |
Using multiple indicators together can improve signal quality and reduce false entries.
For example:
- RSI identifies oversold conditions
- MACD confirms trend direction
- Stochastic confirms momentum shifts
This combination is frequently used in both RSI forex strategy and RSI crypto trading systems.
RSI Limitations and Common Mistakes
Although RSI is highly effective, it is not perfect.
Common mistakes include:
- Treating overbought conditions as automatic sell signals
- Ignoring overall market trends
- Using RSI without confirmation
- Relying solely on divergence signals
Like any indicator, RSI works best when combined with price action, support and resistance levels, and broader market context.
Frequently Asked Questions
Is RSI a leading or lagging indicator?
RSI is generally considered a leading momentum indicator because it can identify potential reversals before they appear in price action.
What is the best RSI setting?
The standard 14-period setting is the most widely used and suitable for most trading situations.
Can RSI be used for crypto trading?
Yes. Many traders use RSI for cryptocurrencies due to the market’s strong momentum swings and volatility.
Is RSI better than MACD?
Neither is inherently better. RSI measures momentum strength, while MACD focuses on trend direction and momentum.
What is the most reliable RSI signal?
Many traders consider bullish and bearish divergence signals combined with support or resistance levels to be among the most reliable RSI setups.