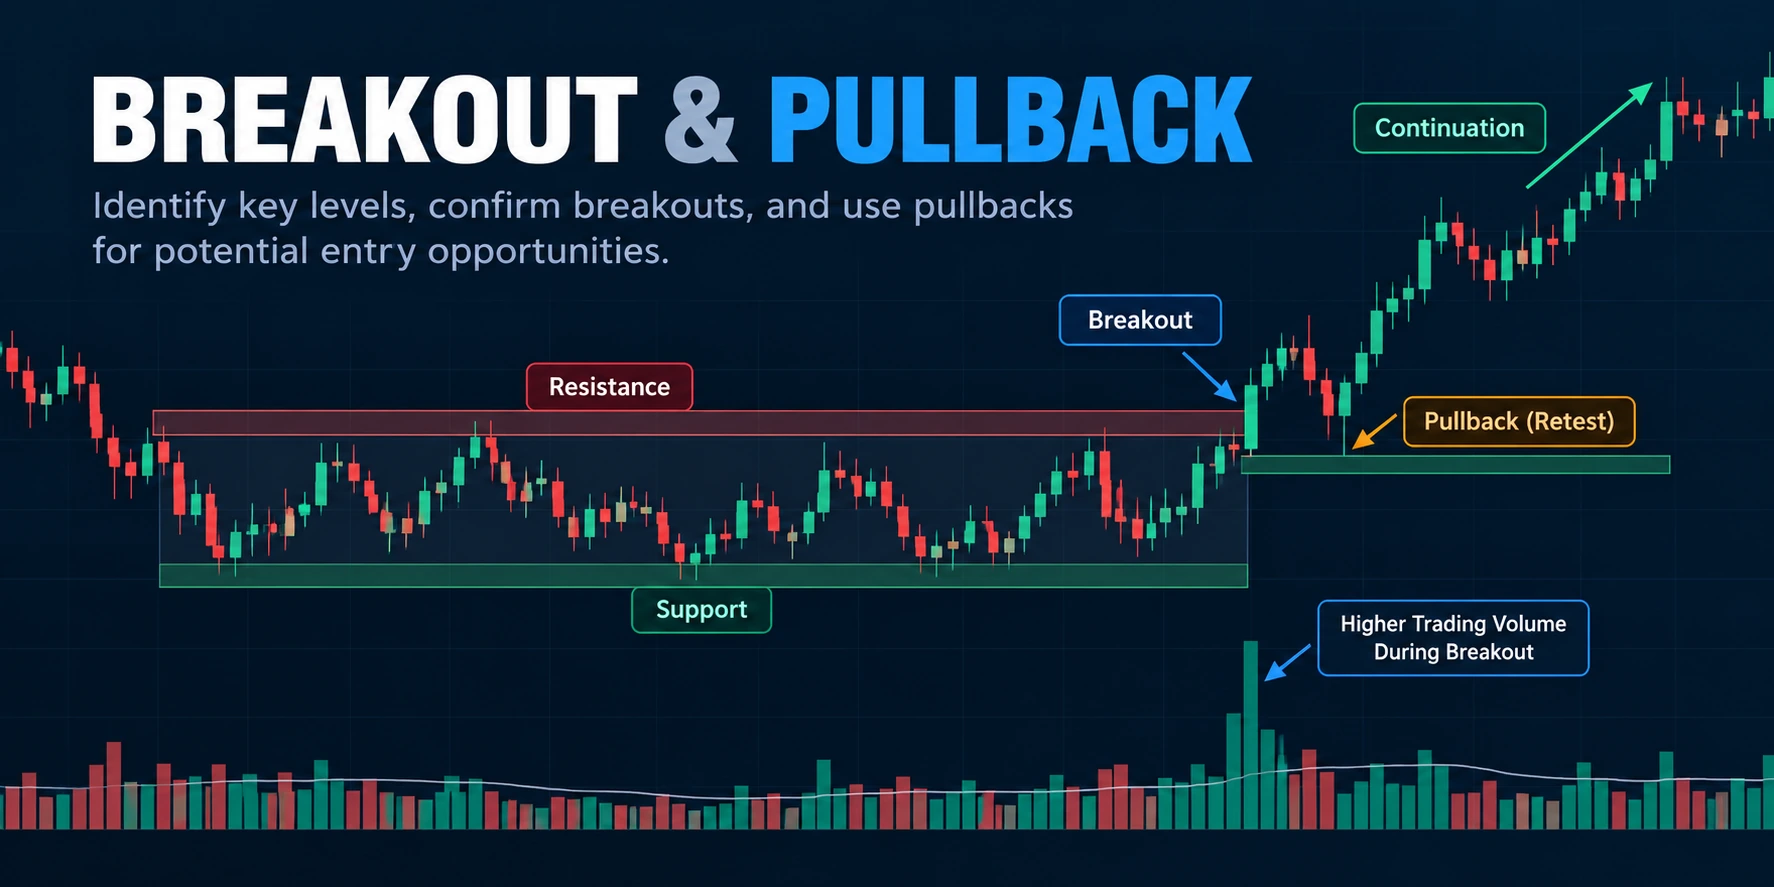
Breakout and Pullback: How to Confirm and Trade Price Moves

Breakout and Pullback trading involves identifying price movements beyond key support or resistance levels and evaluating subsequent retracements. However, not every breakout develops into a sustained trend. Some price moves quickly reverse, leaving traders exposed to false signals and poorly timed entries.
The challenge is determining whether a breakout has genuine market participation, whether the broken level can hold during a pullback, and where a potential trade becomes invalid. Understanding these conditions helps traders evaluate breakout confirmation, identify possible entry opportunities, and manage risk more effectively.
A price moving above resistance does not automatically mean a new uptrend has begun. Some breakouts attract sustained buying interest, while others reverse within a few candles and leave traders holding positions near the top of a short-lived move.
The difficulty is not simply recognizing when price crosses a technical level. It is determining whether the market can sustain that move, whether the broken level remains relevant, and where a trade would become invalid.
Breakout and pullback trading approaches this problem by examining price behavior before, during, and after a move through support or resistance. A breakout identifies a possible change in market structure. A pullback can then reveal whether the new structure is holding or beginning to fail.
Understanding the distinction helps traders avoid treating every movement beyond a trendline or horizontal level as a confirmed trading opportunity.
What Is a Breakout in Trading?
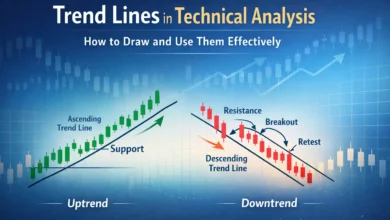
A breakout occurs when price moves beyond a previously established technical boundary. That boundary may be a horizontal resistance level, a support zone, a trendline, or the edge of a consolidation pattern.
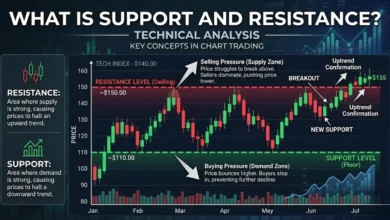
For example, suppose a stock has repeatedly approached $120 but failed to close above it. The repeated reactions establish an identifiable resistance area.
If the stock subsequently closes at $123, it has moved beyond that resistance. Traders can then examine whether the move represents the beginning of sustained price expansion or a temporary excursion outside the previous range.
The distinction matters because a breakout describes what price has done, not what it must do next.
Bullish Breakouts Above Resistance
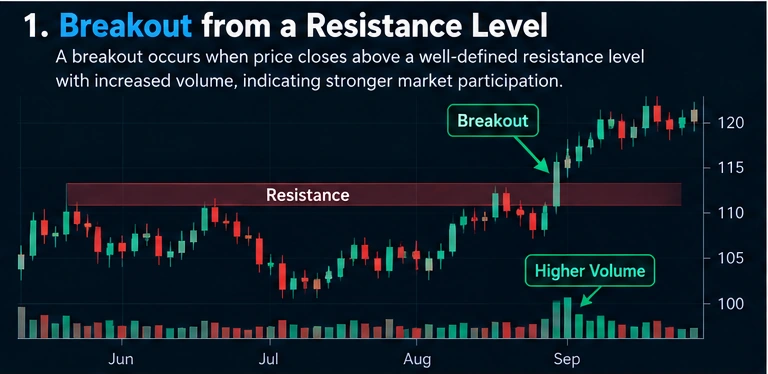
A bullish breakout occurs when price moves above a resistance area that previously limited advances.
It may signal that buyers are willing to transact at higher prices than before. However, the strength of that interpretation depends on how the breakout develops.
A wide bullish candle closing near its high, followed by additional closes above resistance, provides different information from a candle that briefly crosses resistance but finishes back inside the range.
The location of the breakout also matters. A breakout into another significant resistance zone may offer limited room for continuation, even if the initial move appears strong.
Bearish Breakdowns Below Support
A bearish breakdown is the opposite situation: price moves below an established support level.
If a stock has repeatedly found buying interest around $80 and subsequently closes at $77, traders may interpret the move as a potential deterioration in market structure.
Just as with bullish breakouts, the breakdown requires context. A brief move below support followed by an immediate recovery can indicate rejection of lower prices rather than sustained bearish control.
What Makes a Breakout More Convincing?
No single characteristic guarantees that a breakout will succeed. Several observations, however, can help distinguish a developing trend from a weak move beyond a visible price level.
The closing price deserves particular attention. A candle that closes beyond the resistance or support zone provides stronger evidence of price acceptance than a candle that only crosses the level intraperiod.
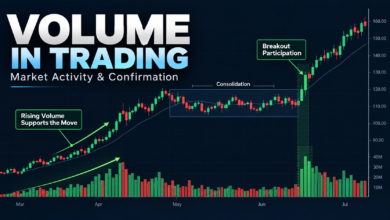
Trading volume adds another layer. A breakout accompanied by activity substantially above its recent average suggests increased participation in the move. That does not reveal the precise intentions of traders, but it provides useful information about market interest.
The structure preceding the breakout is equally relevant. A market that has consolidated for several weeks with repeatedly tested resistance may provide a clearer reference point than an isolated high formed during one volatile trading session.
Finally, consider what happens after the breakout. Continued movement, stable closes beyond the previous boundary, and successful defenses of nearby support can support the original interpretation.
A strong initial candle is useful evidence. Sustained behavior beyond the broken level is a separate and often more demanding test.
How Does Trading Volume Affect Breakout Confirmation?
Volume measures the amount of trading activity taking place during a defined period. It can help traders evaluate participation during a move beyond support or resistance.
Imagine two stocks breaking above comparable consolidation ranges.
The first breaks out on volume approximately twice its recent average. The second moves above resistance while trading activity remains unusually quiet.
The first breakout has stronger evidence of participation, but neither outcome is predetermined. A high-volume move can still fail, and a low-volume breakout can attract additional activity later.
A useful comparison is the Relative Volume ratio:
Relative Volume (RVOL) = Current Volume / Average Volume
An RVOL reading of 2.0 means the current volume is twice the selected historical average. This is descriptive information, not a universal confirmation threshold.
The relevant reference period should match the trading timeframe and market session.
For a deeper explanation of how participation relates to price behavior, see our Volume in Trading guide.
What Is a Pullback After a Breakout?
A pullback is a temporary movement against the prevailing price direction. After a bullish breakout, the price may retreat toward the area it recently moved above.
This behavior is common in financial markets because prices rarely advance in uninterrupted straight lines.
Suppose resistance was established around $120, and price subsequently advances to $128. A decline back toward $120–$122 could represent a pullback to the former resistance area.
Traders monitor whether buying interest returns near that zone.
If price stabilizes and moves upward again, the pullback may support the interpretation that the former resistance has become support.
If price drops decisively back through the area and remains below it, the original breakout becomes less convincing.
A pullback is therefore not inherently bullish or bearish. Its significance comes from where it occurs and how the market responds.
Why Former Resistance Can Become Support
Resistance represents an area where previous advances encountered sufficient selling interest to stall.
Once price moves above that area, market participants may begin treating it differently. Traders who missed the initial breakout may look for opportunities during a retreat, while existing positions may respond to the same level as a reference for risk management.
This change in market behavior is commonly called support and resistance role reversal.
It is not a mechanical rule. A level that acted as resistance several times may fail to provide support after a breakout, particularly during volatile conditions or a broader bearish market environment.
For this reason, support and resistance are often more useful as zones than as exact prices.
How to Identify a Successful Breakout Retest
A retest occurs when price returns to a previously broken level or zone.
For a bullish breakout, traders often watch whether former resistance can withstand renewed selling pressure.
Consider a market that breaks above a resistance zone between $98 and $100. Price advances to $106 before pulling back toward $101.
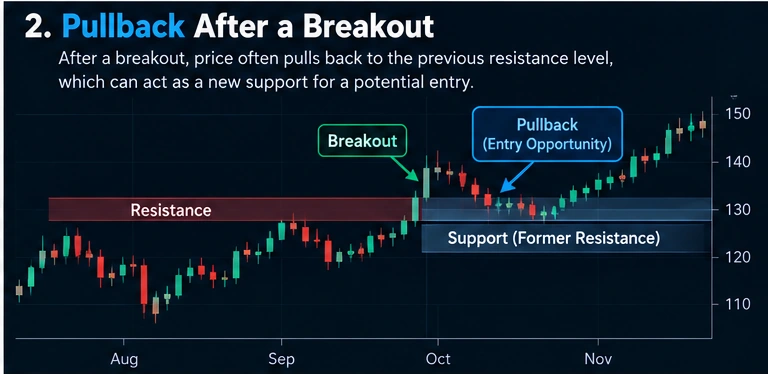
The pullback alone does not establish that support is holding. The more informative observations come afterward.
A rejection of lower prices, stabilization near the former resistance zone, or renewed movement above a short-term swing high can provide evidence of demand.
In contrast, repeated closes beneath the broken resistance may suggest that the breakout has not achieved lasting acceptance.
It is also worth distinguishing a retest from an ordinary retracement. Not every pullback returns to the exact breakout level. Strong trends can continue after shallow corrections, while weaker moves may retrace deeply without immediately becoming invalid.
The trader’s task is to define the relevant zone before evaluating the price response, rather than moving the level retrospectively to fit the latest candles.
Breakout Entry vs. Pullback Entry: Which Is Better?
Breakout and pullback entries represent different trade-offs.
A breakout entry attempts to participate soon after price moves beyond a technical boundary. This approach may capture strong trends that continue without returning to the original resistance level.
The disadvantage is that the entry can occur after a large candle, leaving the position vulnerable to an immediate retracement.
A pullback entry waits for price to retreat toward a technically relevant area before considering a trade.
This can offer a closer invalidation level and a more favorable potential reward relative to the planned risk. However, the anticipated retest may never occur. The market may continue without offering an entry.
| Factor | Breakout Entry | Pullback Entry |
|---|---|---|
| Entry timing | After a break of the level | After a retracement |
| Main advantage | May capture immediate momentum | Can provide a closer technical stop |
| Main limitation | Risk of chasing an extended move | Price may never retest |
| Confirmation | Close beyond the level, volume, follow-through | Support reaction, price stabilization |
| Key risk | False breakout | Pullback develops into a reversal |
Neither approach is universally superior.
The decision depends on the market’s volatility, available distance to the next resistance or support level, the trader’s timeframe, and the quality of the planned risk-reward relationship.
How to Recognize a False Breakout
A false breakout occurs when price moves beyond an important level but fails to sustain the movement.
For example, a stock may trade above $150 resistance during the session but close at $148. The price tested higher levels, yet buyers failed to maintain that advance by the close.
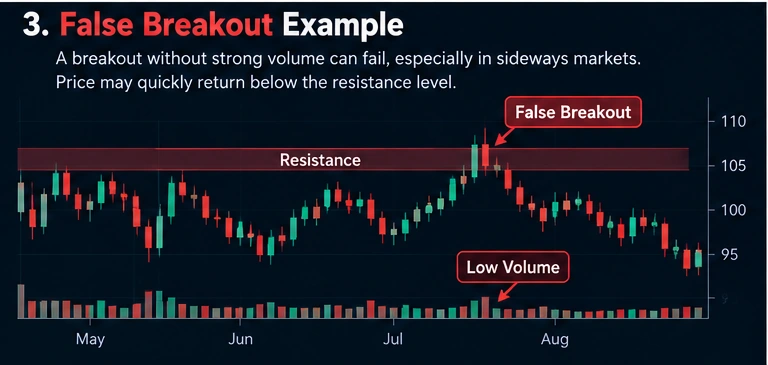
A more deceptive situation develops when price closes above resistance and then falls back below it during subsequent sessions.
Both situations can trap traders who interpret an initial breakout as proof that the trend will continue.
What Are the Warning Signs of a Failed Breakout?
A long upper wick near resistance may suggest rejection of higher prices. Weak follow-through, repeated closes back inside the previous range, or a decisive move through the breakout candle’s low can also raise concerns.
Volume should be interpreted alongside these developments.
Unusually high volume during a failed breakout may indicate heavy two-sided trading and strong rejection. Low volume may suggest limited participation. Neither provides a complete explanation on its own.
The most important consideration is whether the technical level that justified the trade continues to hold.
A breakout strategy should define its failure conditions before entry. Without a predefined invalidation point, a trader may repeatedly reinterpret a deteriorating setup as a normal pullback.
How to Build a Breakout and Pullback Trading Plan
A useful trading plan defines the market condition, entry trigger, invalidation point, and potential exit before a position is opened.
Consider an educational bullish setup with resistance near $120.
Price closes above the level at $123, then advances to $126. Rather than entering immediately, a trader chooses to monitor a possible pullback toward the former resistance zone.
Several sessions later, price retreats to $121 and begins to stabilize. A subsequent bullish candle closes at $123.50.
The trader might consider this recovery a potential entry trigger, provided the broader trend and other technical conditions remain supportive.
Suppose the planned entry is $123.50 and the stop-loss is $119.50. The defined risk is $4 per share.
If the proposed target is $135.50, the potential reward is $12 per share.
Risk = $123.50 − $119.50 = $4.00
Potential Reward = $135.50 − $123.50 = $12.00
Reward-to-Risk Ratio = 3:1
This calculation describes the planned payoff relationship, not the probability of reaching the target.
A 3:1 reward-to-risk ratio does not automatically make a trade attractive. The target must be technically plausible, the stop must reflect the setup’s invalidation, and transaction costs or slippage can affect realized results.
Where Should the Stop-Loss Be Placed?
For a bullish pullback entry, a stop-loss may be positioned beneath the retest low or a nearby support zone, depending on the strategy.
A stop placed too close to the entry can be triggered by ordinary market volatility. A stop placed too far away increases the loss per unit traded.
Some traders use the Average True Range (ATR) indicator to evaluate whether the distance is reasonable relative to recent price fluctuations.
ATR does not identify the correct stop level by itself. It provides a volatility measurement that can be combined with market structure.
How Should Position Size Be Calculated?
Once the risk per share or contract has been defined, position size can be determined from the trader’s maximum acceptable loss.
Position Size = Maximum Trade Risk / Risk Per Unit
For example, a $400 risk budget and a $4 stop distance produce a theoretical position size of 100 shares, before transaction costs and slippage.
This calculation helps separate trade quality from position size. A technically valid breakout should not require risking an uncontrolled portion of trading capital.
How Moving Averages and RSI Can Support Pullback Analysis
Moving averages can provide additional context for a pullback, particularly during established trends.
In an uptrend, price may periodically retreat toward a rising 20-period or 50-period moving average before resuming its advance.
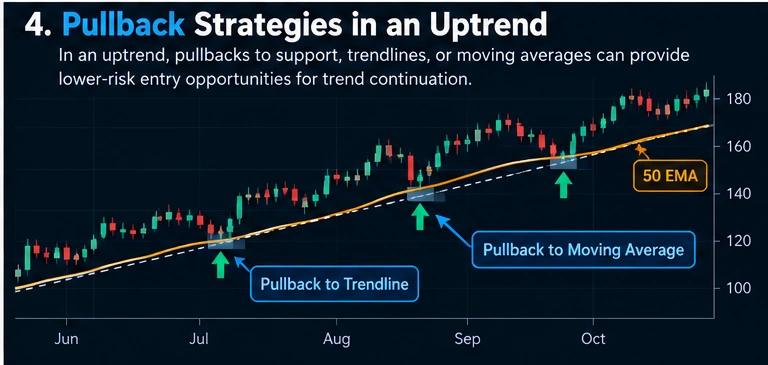
Such reactions can identify areas worth monitoring, although the moving average is not guaranteed to act as support.
The Relative Strength Index (RSI) offers a different perspective by measuring price momentum.
A pullback that holds above a major support zone while RSI recovers above its midpoint may provide additional evidence of improving momentum. Nevertheless, RSI can produce misleading signals, especially during sideways or highly volatile conditions.
Combining indicators should clarify the setup rather than create a collection of redundant signals.
How Timeframes Change Breakout and Pullback Analysis
A breakout on a five-minute chart and a breakout on a weekly chart may look similar, but they describe different market structures.
Shorter timeframes contain more frequent fluctuations and may produce many temporary moves beyond support and resistance.
Longer timeframes can provide broader context, though signals may develop more slowly and require larger stop distances.
A practical approach is to identify major levels on a higher timeframe and use a lower timeframe to examine the price behavior around those areas.
For instance, a daily resistance zone may establish the broader setup, while a four-hour chart helps assess the retracement and subsequent reaction.
The lower timeframe should not override important higher-timeframe evidence without a clear reason.
Common Mistakes in Breakout and Pullback Trading
One frequent mistake is entering after an unusually large breakout candle without considering the distance to the nearest invalidation level.
Another is assuming that every broken resistance level will become support.
Traders may also place too much weight on volume without checking how price behaves after the breakout.
Waiting for the perfect retest can be equally problematic. Some strong trends do not revisit the original breakout level, and forcing an entry after the price has already moved away can undermine the planned trade.
A further mistake is treating a profitable historical chart example as evidence that the same pattern will work consistently across all assets and market conditions.
Breakout and pullback strategies should be evaluated through repeated observations and appropriately designed backtesting, with transaction costs and failed setups included.
Frequently Asked Questions About Breakout and Pullback Trading
Is a pullback the same as a trend reversal?
No. A pullback is a temporary movement against the prevailing trend. A reversal involves a more substantial change in market direction or structure. The distinction becomes clearer through subsequent swing highs, swing lows, and reactions around technical levels.
Does every breakout need a retest?
No. Some breakouts continue without returning to the original resistance or support zone. Waiting for a retest can improve entry conditions in certain setups but also means missing moves that never pull back.
Is high trading volume necessary for a valid breakout?
Higher-than-average volume can support a breakout interpretation, but it is not a universal requirement. Price structure, the closing location, and subsequent trading behavior remain important.
What is the difference between a pullback and a throwback?
A pullback is a broad term for a temporary counter-trend movement. In traditional chart-pattern terminology, a throwback more specifically describes a return toward a previously broken resistance level after an upward breakout.
Can a breakout fail after a successful retest?
Yes. Holding a retested level initially does not guarantee continuation. Changing market conditions can cause price to break below support later, making predefined risk management essential.
Which timeframe is best for breakout trading?
There is no universally best timeframe. Shorter intervals offer more frequent setups but often include more noise, while higher timeframes can provide broader structure. The appropriate choice depends on the trading horizon and risk management approach.
Final Thoughts: Evaluate the Level, Not Just the Break
A breakout identifies a potential change in market structure. A pullback helps traders examine whether that change is being maintained.
Neither event should be interpreted in isolation.
The quality of a setup depends on the location of the technical level, the closing behavior around it, market participation, the broader trend, and the relationship between potential reward and defined risk.
Before considering a breakout or pullback trade, identify the conditions that would support the setup and the price behavior that would invalidate it.
That distinction turns a chart pattern from a visual observation into a testable trading plan.