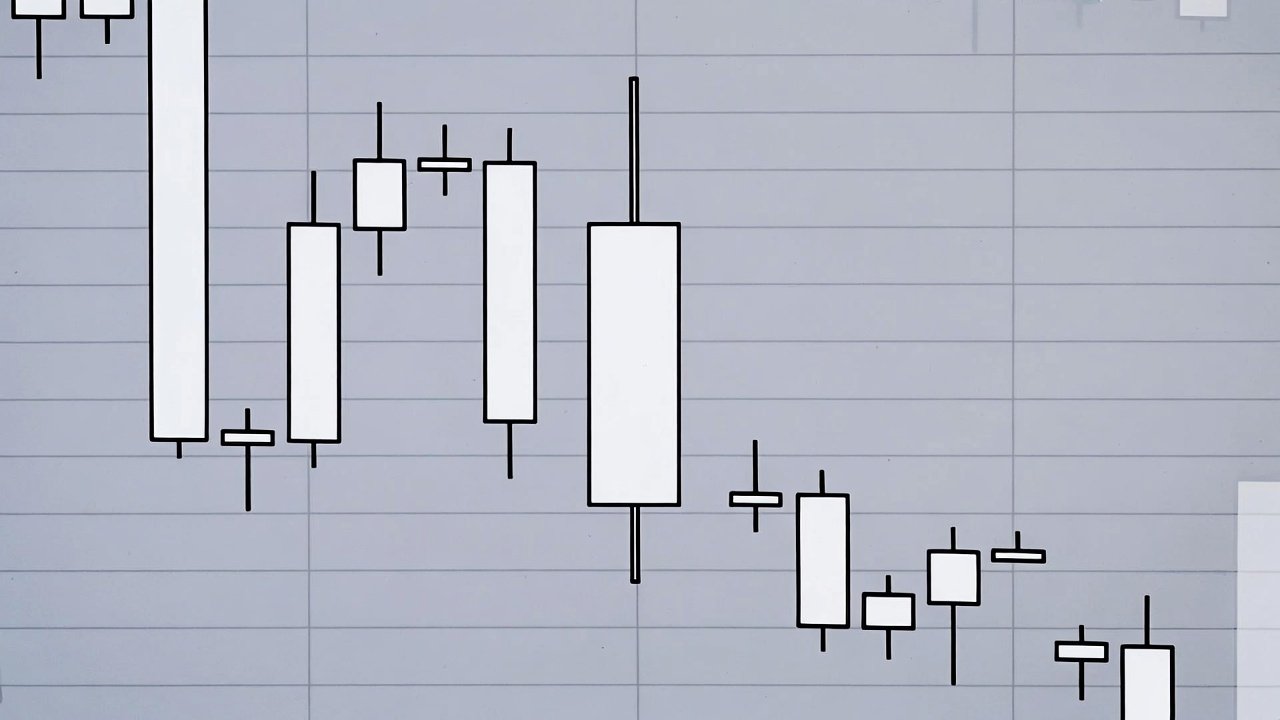

The Doji candlestick stands as one of the clearest signals of market hesitation in technical analysis. When the opening and closing prices are nearly identical, the candle forms a thin horizontal line with possible upper and lower shadows. This shape immediately tells traders that buyers and sellers fought to a draw by the end of the session. Neither side managed to push the price decisively in their favor, creating a visual representation of balance and uncertainty.
Understanding the Core Structure of a Doji
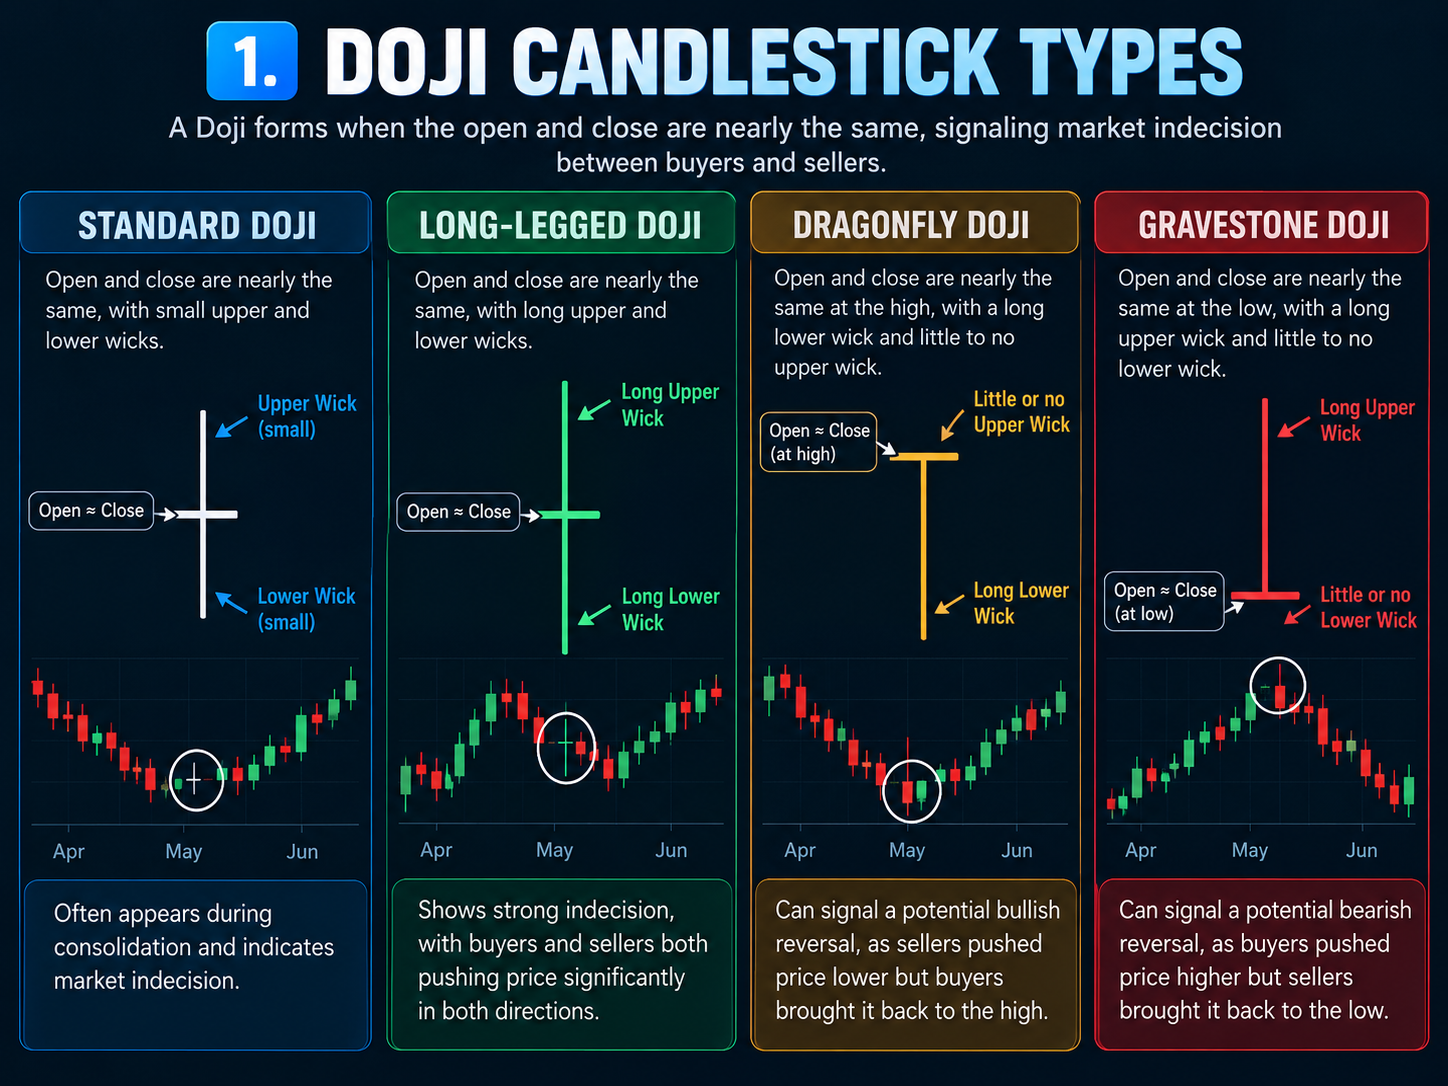
A true Doji appears when the open price and close price land at almost the exact same level. The real body shrinks dramatically or disappears entirely, leaving only the wicks to show the high and low of the period. Shadow lengths vary depending on how volatile the trading was. Long upper and lower shadows indicate wild swings throughout the session, yet the price still returned to its starting point. Shorter shadows suggest a calmer battle with the same neutral outcome.
Traders recognize several common variations. The standard Doji features roughly balanced upper and lower wicks. A long-legged Doji displays extended shadows on both sides, highlighting extreme indecision and higher volatility. The dragonfly Doji shows a long lower shadow with almost no upper wick, while the gravestone Doji presents the opposite configuration with a prominent upper shadow. Each version carries slightly different nuances based on where it forms in the chart.
What the Doji Really Signals to Traders
At heart, the Doji represents equilibrium in the market. Bulls may drive prices higher temporarily, only for bears to pull them back down to the opening level. Or sellers push lower before buyers recover the lost ground. This back-and-forth leaves the candle closing where it began, often warning that the current trend is losing strength.
The pattern gains real power from its context. A lone Doji in the middle of sideways movement usually means little. However, when it appears after a strong uptrend or sharp downtrend, it acts as a potential reversal alert. Higher trading volume during the Doji session strengthens the message, showing that more participants are actively questioning the prevailing direction.
Doji Patterns in Different Market Trends
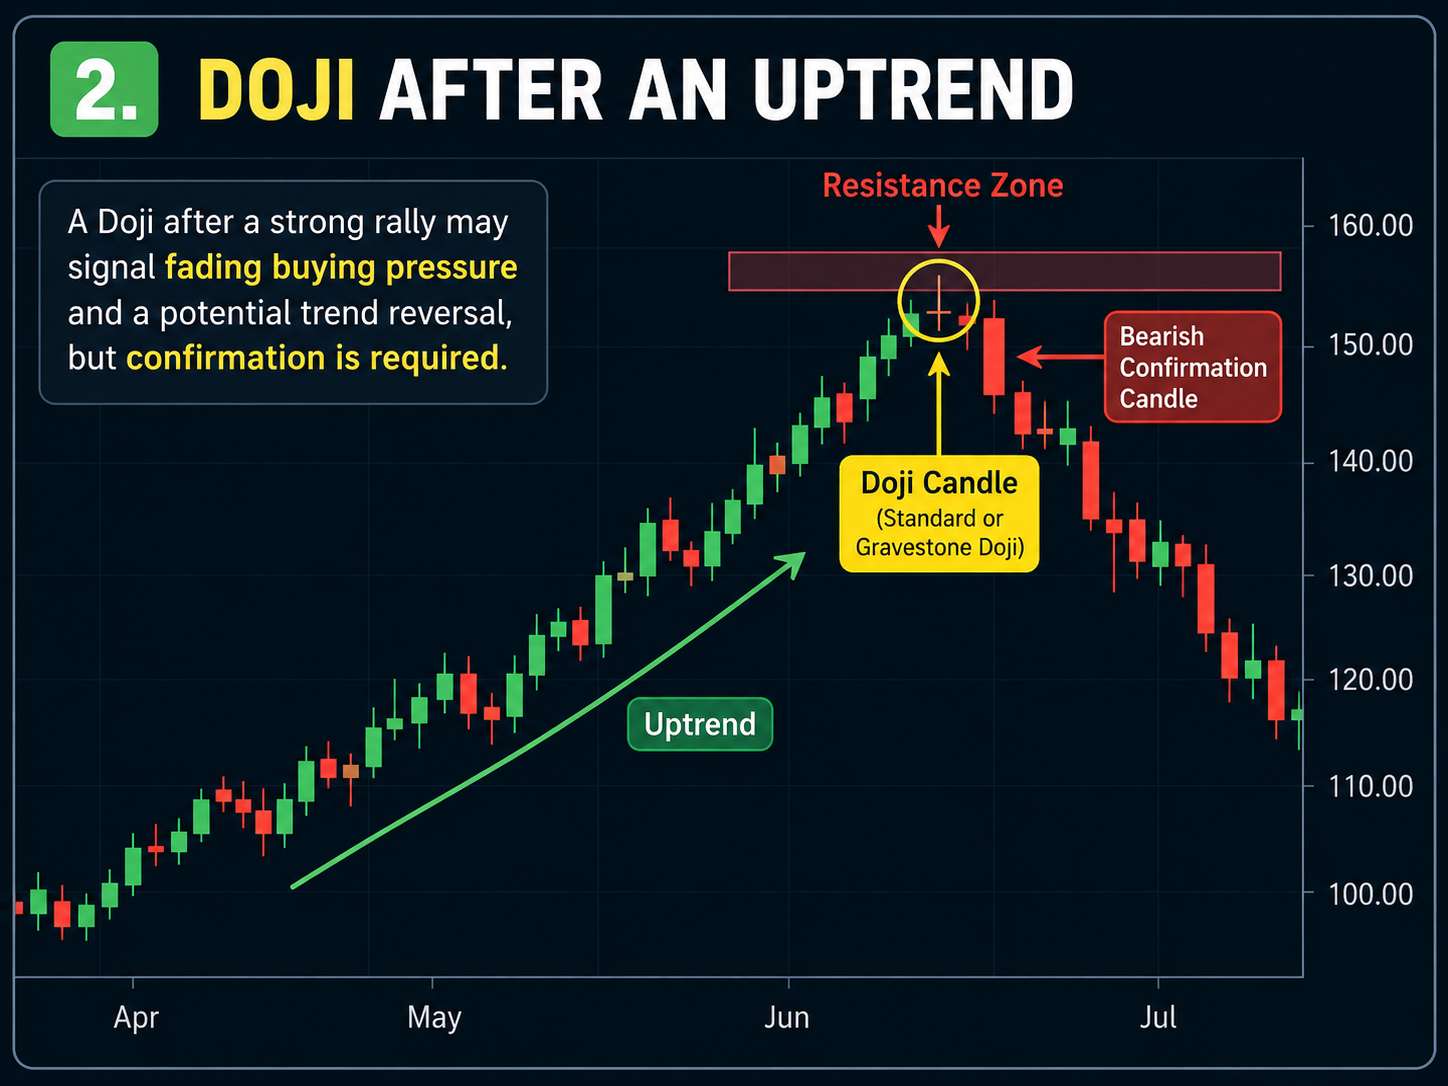
In an established uptrend, a Doji often hints that buying pressure is fading. Sellers have stepped in strongly enough to cancel out further gains, suggesting the rally might stall or reverse. Traders watch the following candles closely for confirmation before acting on this signal.
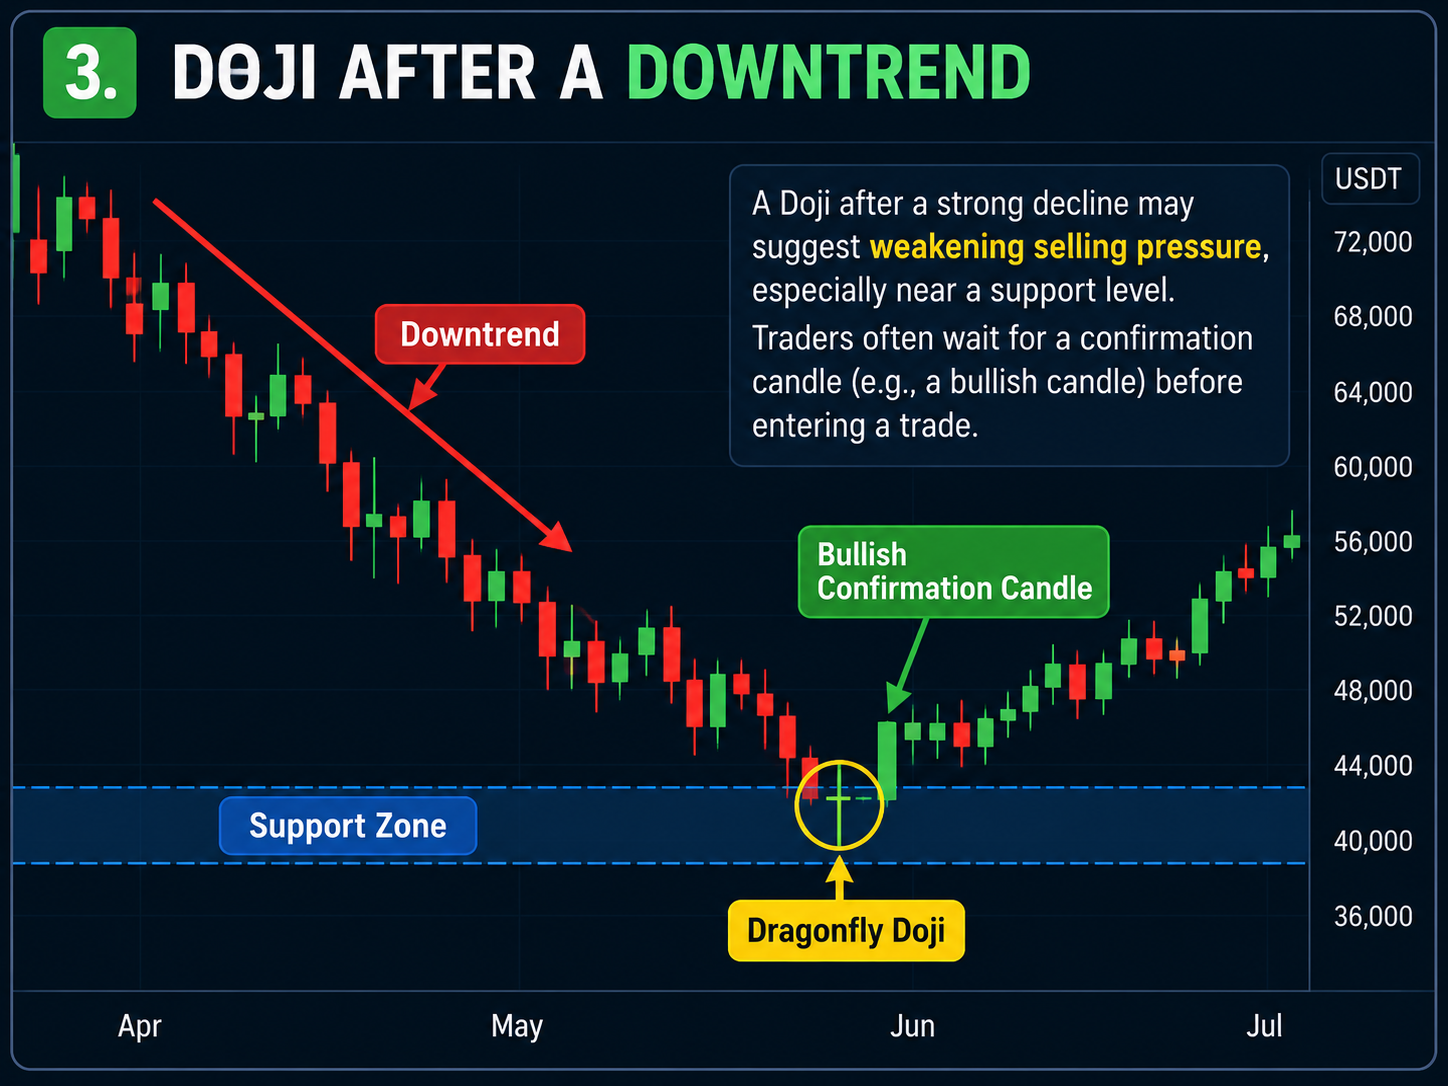
During a downtrend, the same Doji shape can indicate that selling momentum is weakening. Bears drive the price lower but fail to keep it there, allowing bulls to push back by the close. This setup frequently precedes a bounce or even a full trend change when supported by other bullish clues. The dragonfly Doji, in particular, tends to perform well near support levels as it shows buyers successfully defending key prices.
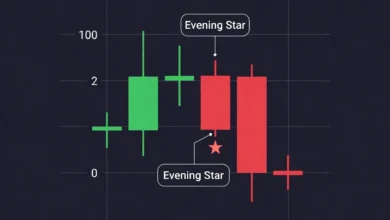
A Doji can also appear as part of a multi-candle reversal formation. For example, the Morning Star pattern is a bullish reversal setup that may include a small-bodied candle or Doji between a bearish candle and a bullish confirmation candle.
Effective Ways to Trade the Doji
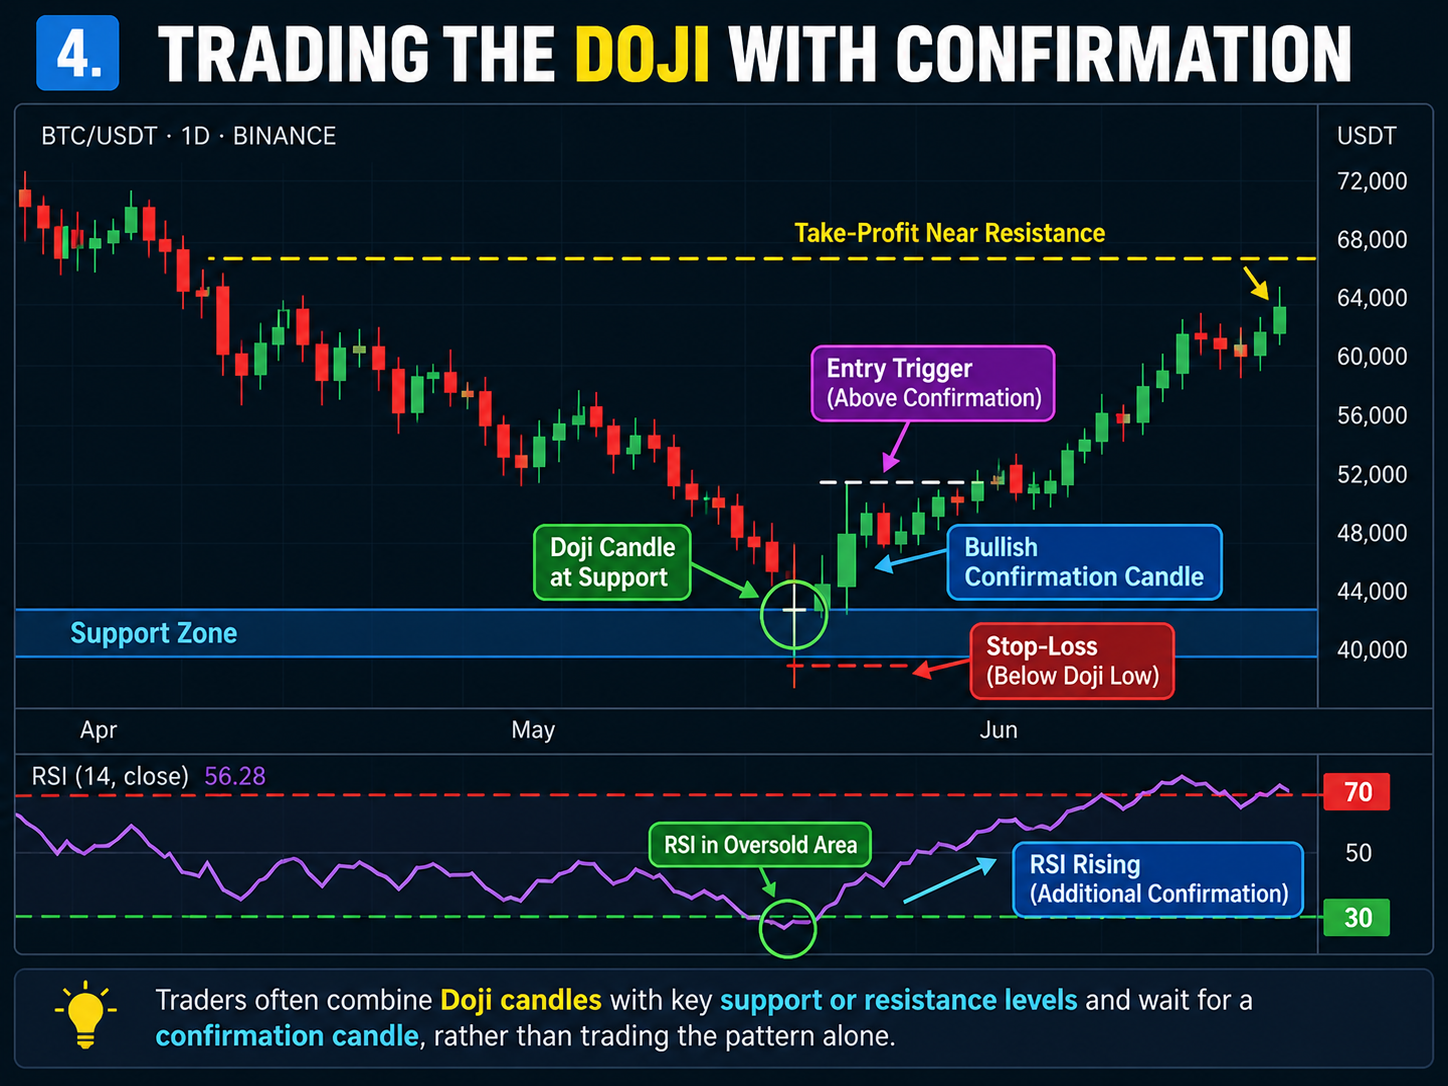
No serious trader uses the Doji in isolation. Combining it with support and resistance levels dramatically improves accuracy. A Doji forming exactly at a major support zone after a decline carries far more weight than one appearing randomly. Likewise, a Doji near resistance in an uptrend strengthens the case for a potential pullback.
Many traders prefer to wait for confirmation on the next candle. A strong bearish close below the Doji’s low after an uptrend Doji provides clearer entry signals. Proper risk management is essential. Stop-loss orders placed just beyond the Doji’s highest or lowest point help limit losses if the pattern fails. This approach keeps reward-to-risk ratios healthy even when some setups do not work out.
Traders may combine Doji candlesticks with the Relative Strength Index (RSI) to assess momentum conditions. A Doji near support accompanied by bullish RSI divergence may provide additional evidence of weakening selling pressure, although it does not guarantee a reversal.
Fibonacci retracement levels also pair nicely when a Doji appears near important percentage lines.
Avoiding Common Pitfalls with Doji Candles
One frequent mistake is reacting to every single Doji that appears. In low-volatility or ranging markets, Doji formations happen often without leading to meaningful moves. Experienced traders filter these out by focusing on higher timeframes or requiring multiple confirming signals.
Another error involves ignoring the specific characteristics of the traded asset. Major currency pairs and large-cap stocks usually produce cleaner Doji signals than low-volume cryptocurrencies or penny stocks. Session timing also matters in intraday charts, where Doji patterns near market open or close can reflect different dynamics than those in the middle of the day.
Developing Skill with the Doji Pattern
The Doji serves as a valuable pause signal that encourages traders to reassess rather than chase momentum blindly. When interpreted correctly within the right market context and backed by confirmation, it helps identify potential turning points with greater precision.
Consistent practice across different market conditions builds the intuition needed to distinguish high-probability Doji setups from less reliable ones. Backtesting various scenarios helps traders understand which Doji variations work best in specific environments.
By respecting the Doji’s core message of indecision while demanding supporting evidence before committing capital, traders can sharpen their market timing and improve overall risk control. The pattern does not promise reversals every time, yet it consistently highlights moments when the balance of power may be shifting.