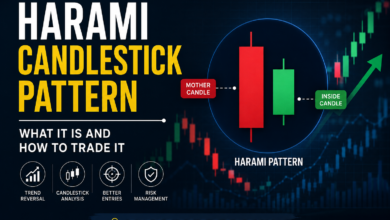
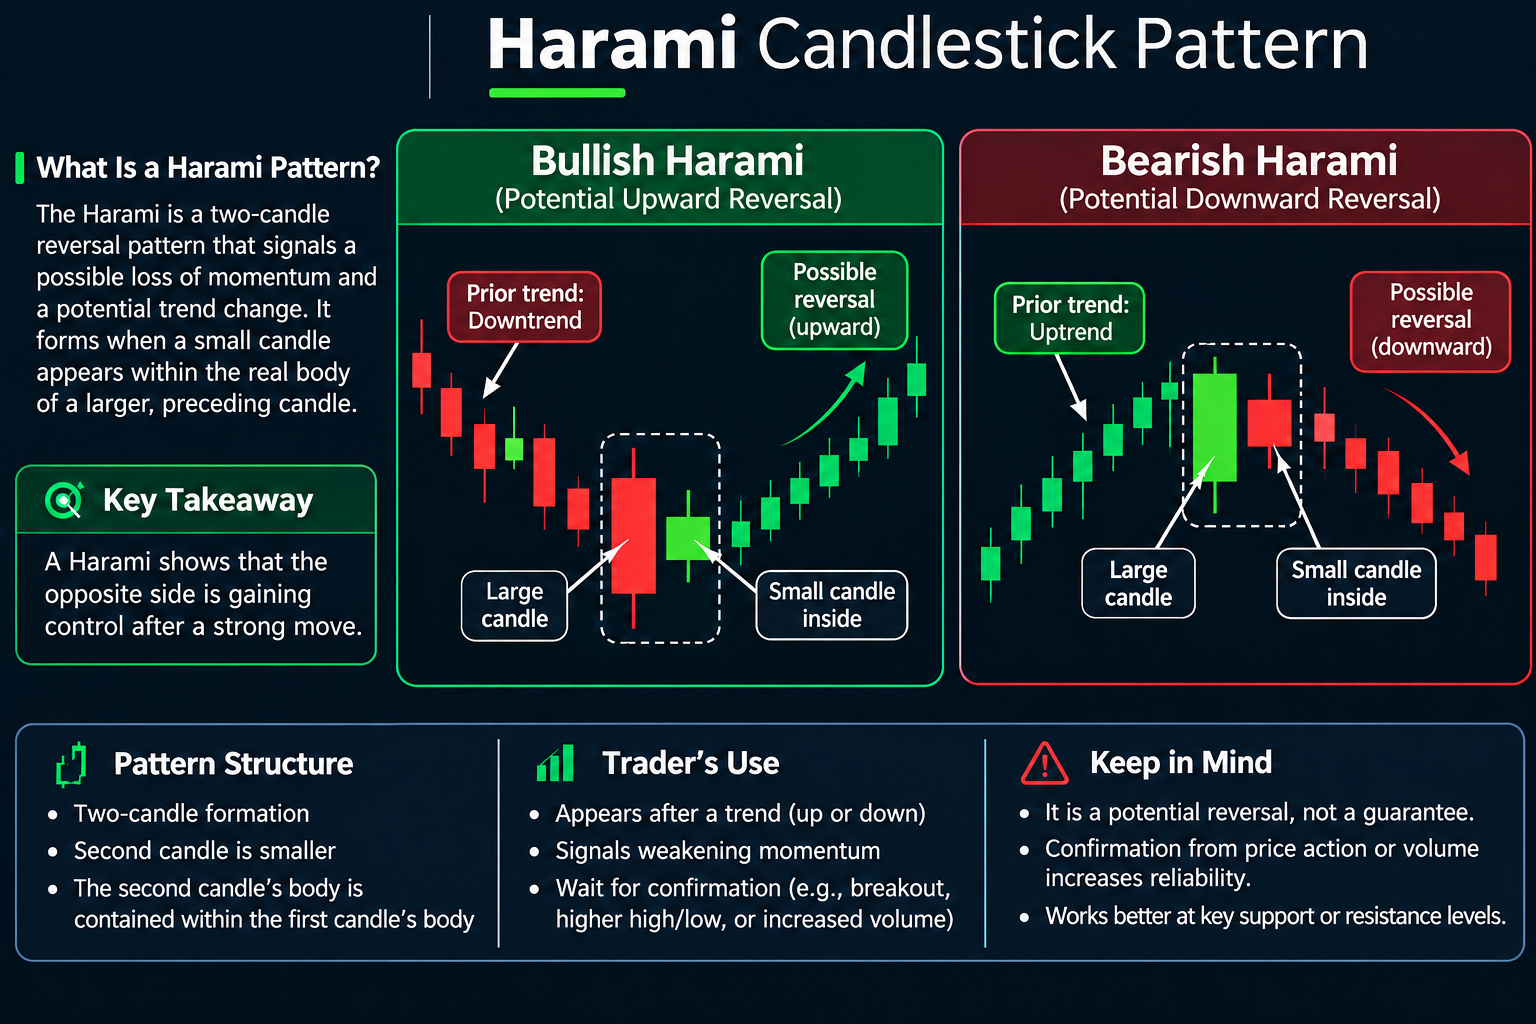

The Harami Candlestick Pattern is a two-candle formation that can signal weakening momentum and a possible change in market direction. It appears when a large candle is followed by a much smaller candle whose real body remains inside the body of the previous candle. Depending on where it forms, the pattern can appear as either a bullish Harami or a bearish Harami.
Unlike stronger reversal formations that immediately show aggressive movement in the opposite direction, the Harami often represents hesitation. One side of the market has been dominant, but the smaller second candle suggests that momentum is beginning to slow.
For that reason, traders generally treat a Harami as an early warning rather than an automatic buy or sell signal.
What Is a Harami Candlestick Pattern?
A Harami consists of two candles.
The first candle normally has a relatively large real body and reflects the direction of the existing trend. The second candle is significantly smaller and develops inside the real body of the first candle.
The name “Harami” comes from a Japanese word associated with pregnancy because the smaller candle appears to sit inside the larger candle.
The key characteristics are:
- The pattern contains two candles.
- The first candle has a relatively large real body.
- The second candle has a smaller real body.
- The second candle’s body is contained within the first candle’s body.
- It normally appears after an identifiable trend or directional move.
- Confirmation is usually required before treating it as a reversal.
The position of the pattern within the broader trend is more important than the pattern alone.
Bullish Harami Candlestick Pattern
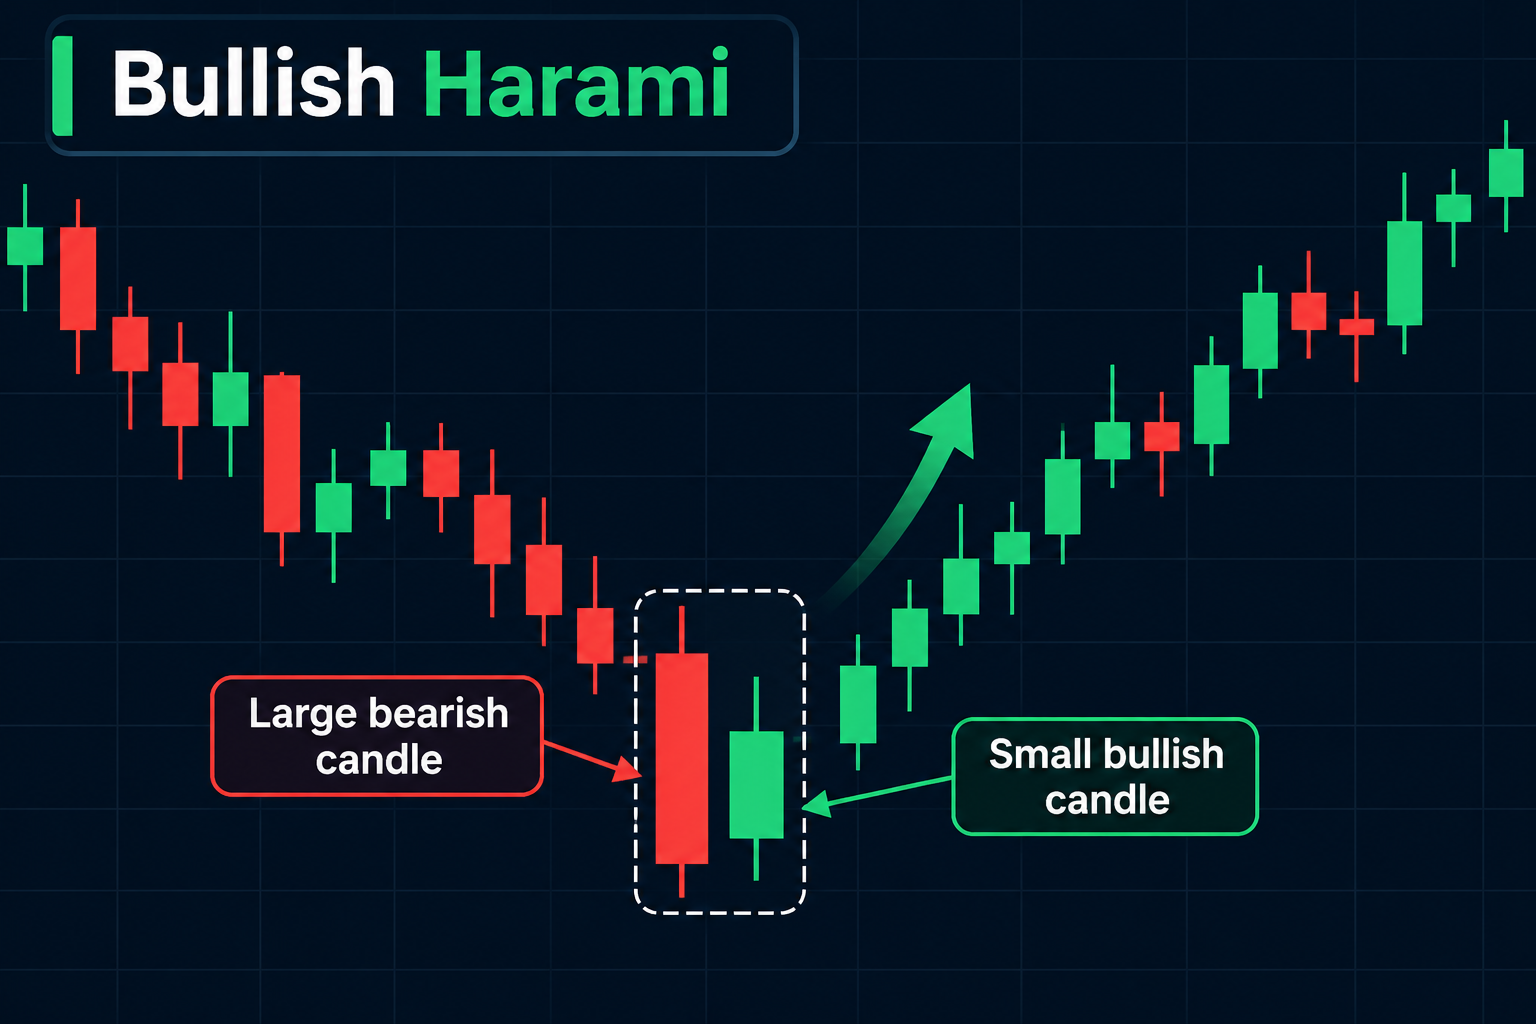
A bullish Harami normally appears after a downtrend.
The first candle is a large bearish candle, showing that sellers remain in control. The following session produces a smaller candle whose real body remains inside the body of the previous bearish candle.
This reduction in candle size suggests that selling pressure has weakened.
The pattern itself does not prove that buyers have taken control. Instead, it indicates that the previous bearish momentum may be losing strength.
A stronger bullish setup develops when the Harami forms near:
- an established support level,
- a previous swing low,
- a major moving average,
- an oversold momentum condition,
- or another technically significant price zone.
Bullish Harami Confirmation
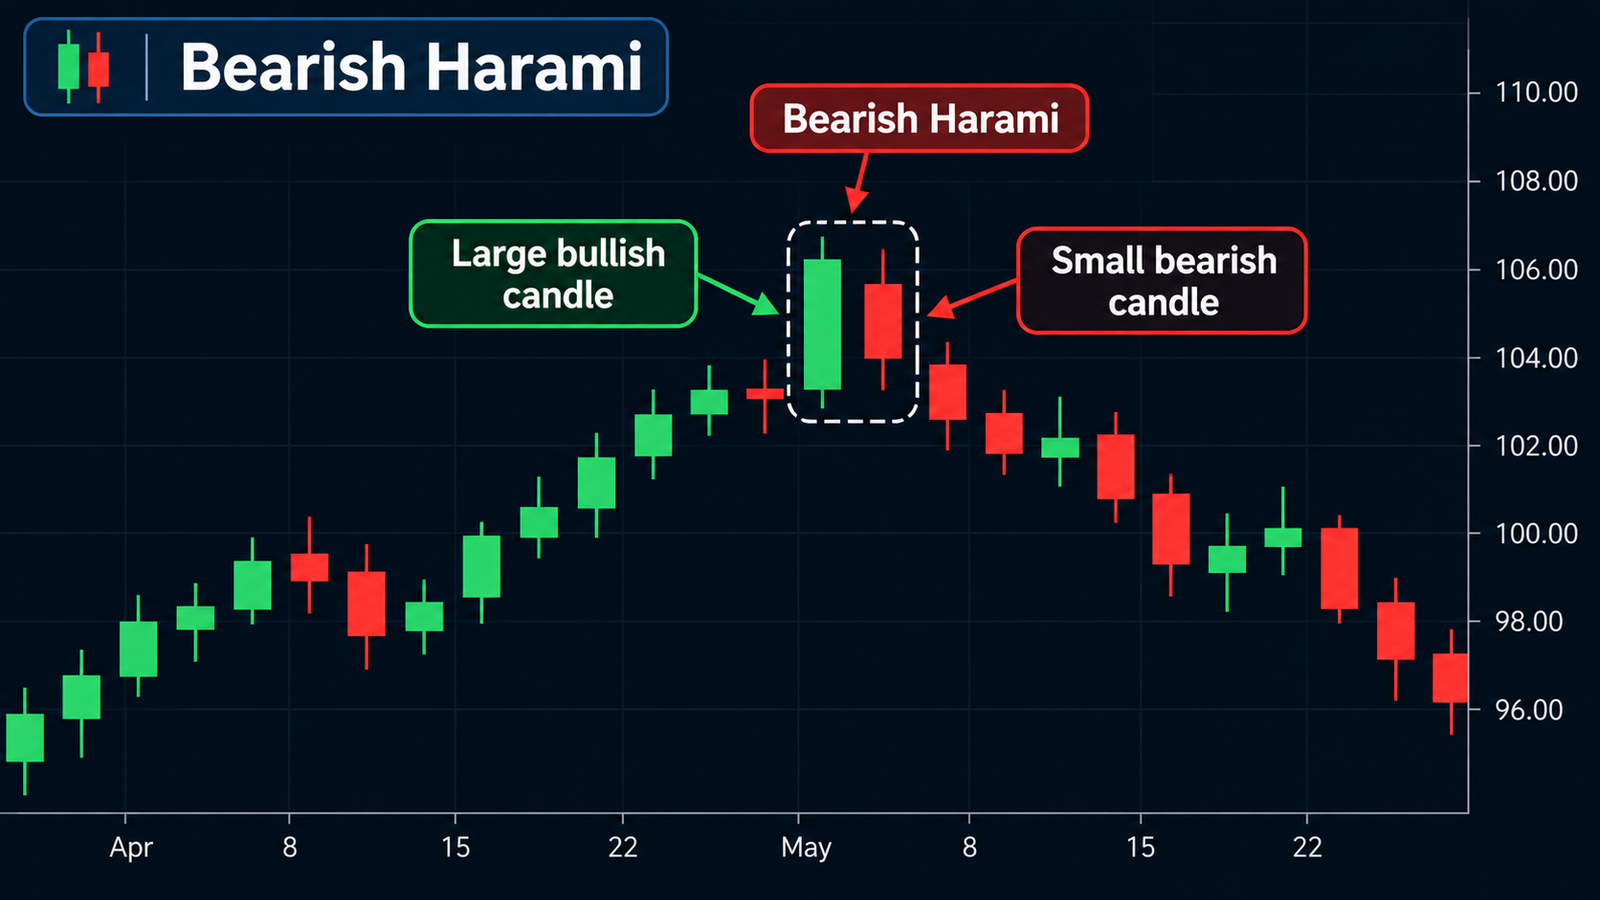
Confirmation can come from the candle following the Harami.
Traders may look for price to close above the high of the smaller candle or, more conservatively, above an important short-term resistance level.
Increasing volume during the bullish confirmation move can provide additional evidence that buyers are becoming more active.
Bearish Harami Candlestick Pattern
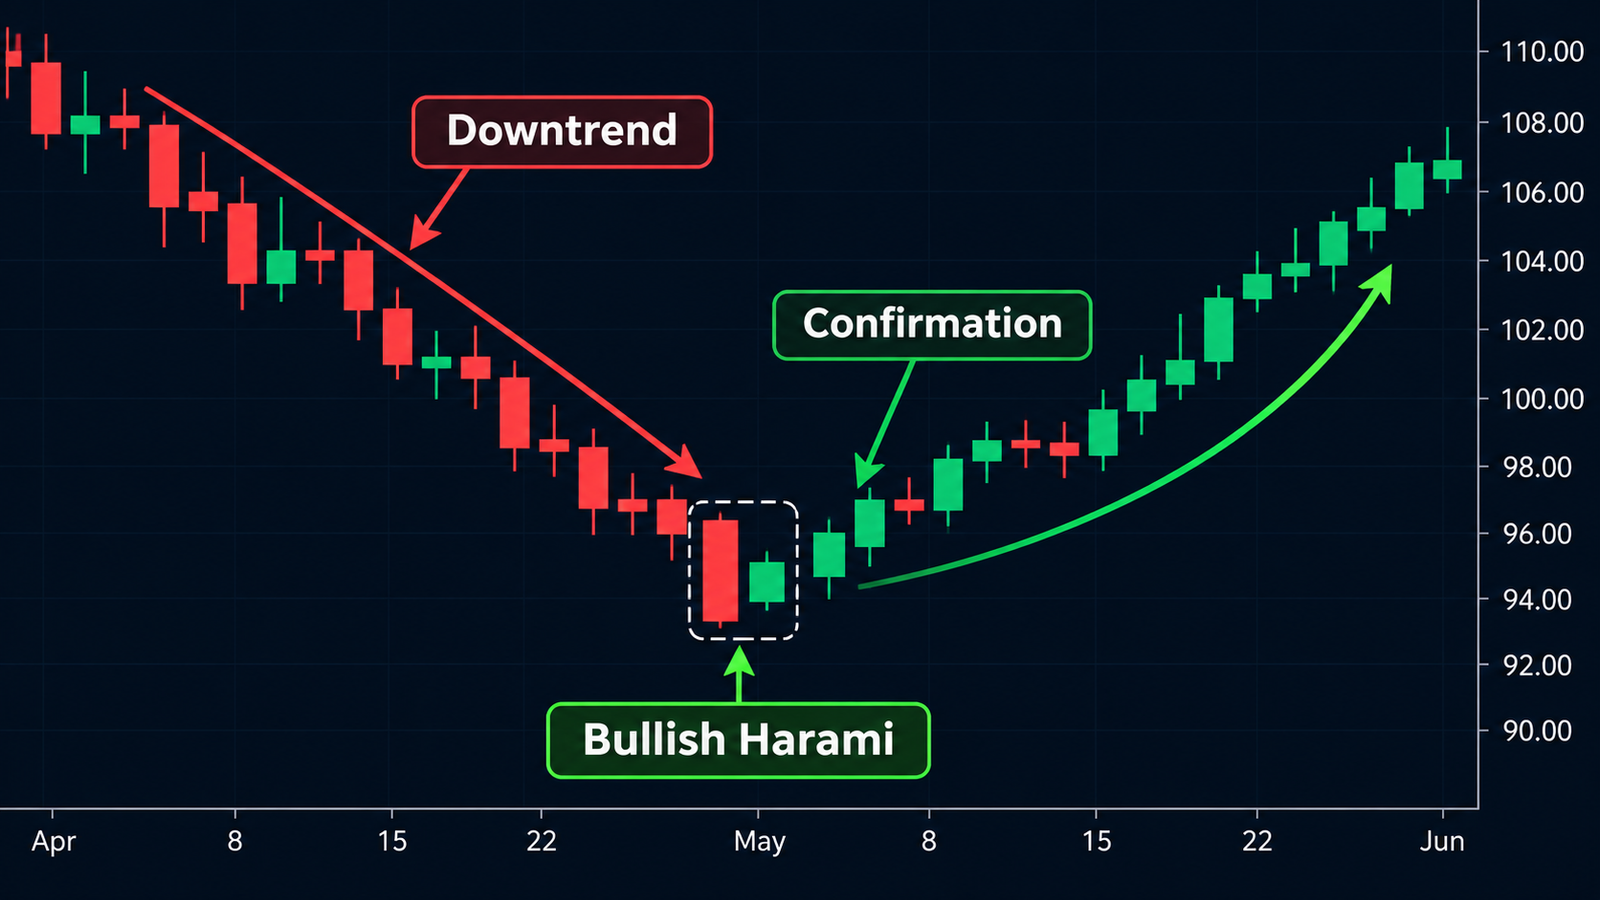
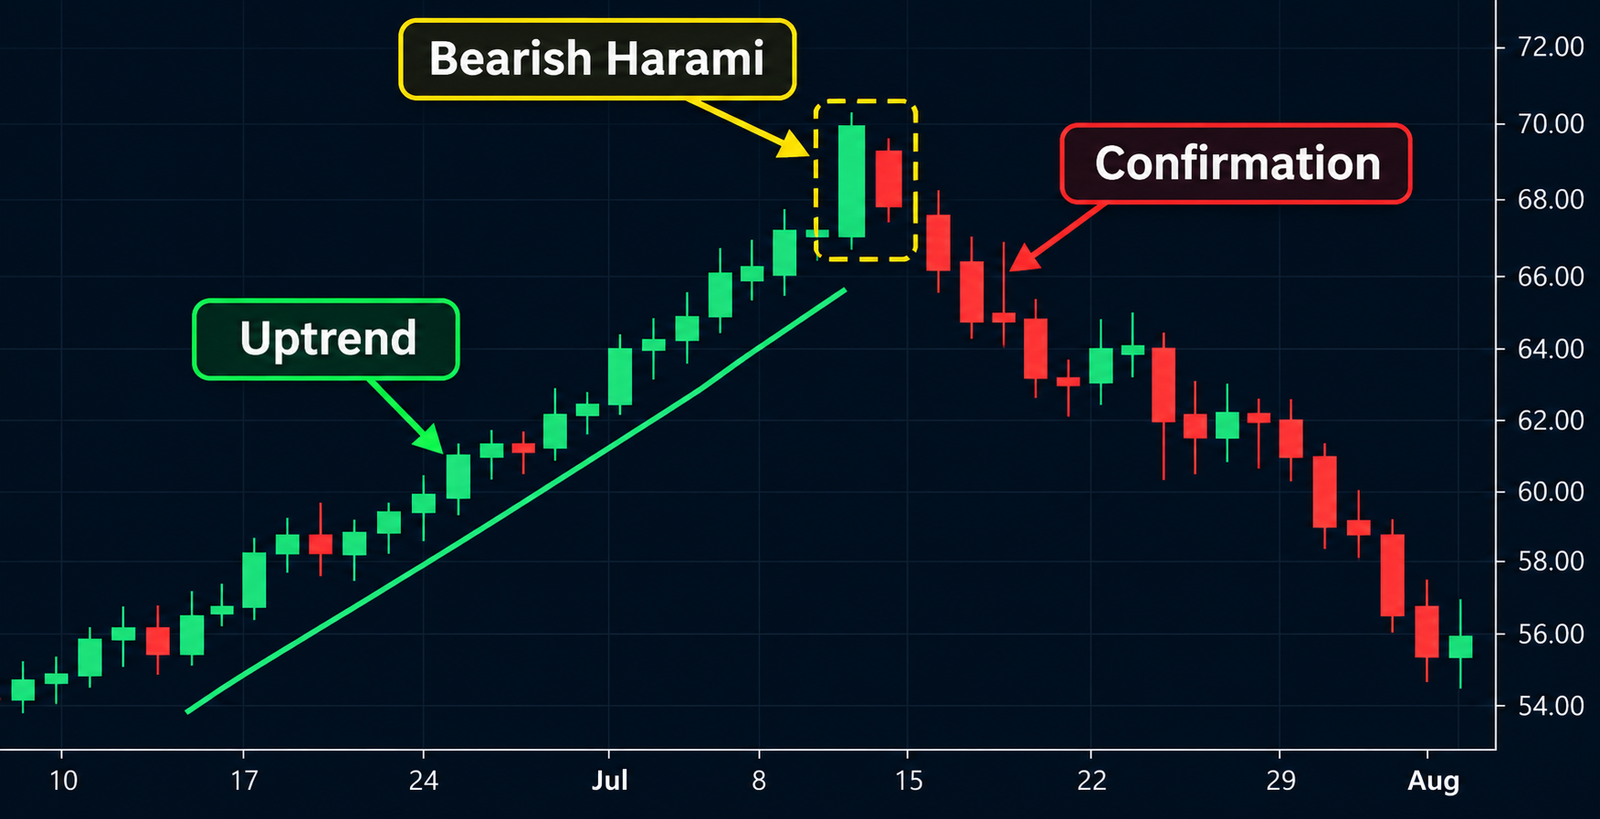
A bearish Harami develops after an uptrend or sustained bullish move.
The first candle is usually a large bullish candle showing strong buying pressure. It is followed by a smaller candle contained within the first candle’s real body.
The sudden reduction in range suggests that buyers are no longer pushing price higher with the same strength.
This can be an early sign of weakening bullish momentum.
Bearish Harami patterns can become more significant when they appear near:
- resistance levels,
- previous swing highs,
- overbought conditions,
- major trendline resistance,
- or after an extended rally.
However, the pattern should not automatically be interpreted as a short signal.
Bearish Harami Confirmation
Traders commonly wait for additional bearish price action.
A close below the low of the Harami formation, a break of short-term support, or the development of a lower high can provide stronger evidence that market structure is beginning to change.
Why Confirmation Matters
One of the most important aspects of trading the Harami Candlestick Pattern is confirmation.
A smaller candle inside a larger candle primarily shows contraction in price movement. It tells traders that momentum has slowed, but it does not reveal with certainty which side will control the next move.
For example, a bearish Harami can appear during a strong uptrend and simply become a temporary consolidation before the rally continues.
Similarly, a bullish Harami inside a powerful downtrend may fail if buyers cannot generate follow-through.
Confirmation helps separate genuine reversals from temporary pauses.
Useful confirmation methods include:
- a break of the Harami high or low,
- a break of nearby support or resistance,
- higher volume in the reversal direction,
- a change in swing structure,
- momentum divergence,
- and confirmation from another technical indicator.
Harami Pattern and Market Structure
The Harami becomes more useful when interpreted together with market structure.
Suppose price has been producing lower highs and lower lows. A bullish Harami forms near support, but the market continues to produce lower highs afterward.
In that case, the broader bearish structure has not yet changed.
A more convincing reversal would occur if price forms the bullish Harami, breaks above a recent swing high, and begins producing higher lows.
The same logic applies to a bearish Harami.
If the market remains in a strong sequence of higher highs and higher lows after the pattern appears, the primary uptrend may still be intact.
Candlestick patterns are most useful when they are placed inside the larger context of trend structure.
Volume and the Harami Pattern
Volume can help traders evaluate the quality of a Harami setup.
A reversal becomes more interesting when the dominant trend begins losing participation and volume expands during the confirmation move.
For example, consider a bullish Harami after a long decline.
If selling volume decreases during the final stages of the downtrend and volume expands when price breaks above the Harami formation, the reversal may have greater technical significance.
Volume should still be treated as confirmation rather than a standalone signal.
Harami vs Inside Bar
The Harami and the inside bar are similar but are not exactly the same concept.
A Harami focuses primarily on the real bodies of the two candles. The second candle’s body should remain inside the body of the first candle.
An inside bar normally requires the entire price range, including the high and low, to remain inside the previous candle’s range.
This distinction is important because a candle can qualify as a Harami while its wick extends beyond the previous candle’s high or low.
Harami vs Engulfing Pattern
The Harami can also be viewed as almost the opposite of an engulfing pattern.
In a Harami:
- the first candle is large,
- the second candle is smaller,
- and the second body sits inside the first.
In an engulfing pattern:
- the second candle expands,
- and its real body covers or engulfs the previous candle’s body.
The engulfing pattern therefore shows expansion in the new direction, while the Harami initially shows hesitation and contraction.
This is another reason confirmation is especially important when trading a Harami.
How to Trade a Bullish Harami
A possible bullish trading process may look like this:
- Identify an established downtrend.
- Wait for a large bearish candle.
- Look for a smaller candle contained inside the first candle’s real body.
- Check whether the setup is near meaningful support.
- Wait for bullish confirmation.
- Evaluate volume and market structure.
- Define invalidation before entering a trade.
A trader may place an invalidation level below the pattern or below the nearby swing low depending on the broader setup.
The exact approach depends on volatility, timeframe, and risk management rules.
How to Trade a Bearish Harami
The bearish process works in the opposite direction.
First identify a mature uptrend or extended bullish move.
After a large bullish candle, look for a smaller candle contained inside the first candle’s body.
Then wait for evidence that sellers are actually gaining control.
A bearish close below the formation, a lower high, or a support breakdown can provide better confirmation than entering immediately after the Harami appears.
Common Harami False Signals
The biggest mistake is treating every Harami as a reversal.
Harami formations occur frequently, particularly during sideways and low-volatility markets.
A pattern can fail when:
- it forms without a clear prior trend,
- it appears in the middle of a trading range,
- the dominant trend remains extremely strong,
- there is no follow-through,
- volume does not support the reversal,
- or nearby support and resistance contradict the setup.
The strongest Harami setups usually combine several forms of technical evidence rather than relying on the two candles alone.
Harami Candlestick Pattern Reliability
No candlestick pattern guarantees a reversal.
The reliability of a Harami depends heavily on context.
A Harami near a major support or resistance area can be more meaningful than the same formation appearing randomly in the middle of a range.
Trend maturity, volume, volatility, market structure, and confirmation all affect the quality of the signal.
For this reason, experienced traders often use the Harami as part of a broader technical analysis process rather than as an independent trading system.
Bullish vs Bearish Harami
| Feature | Bullish Harami | Bearish Harami |
|---|---|---|
| Prior trend | Downtrend | Uptrend |
| First candle | Large bearish candle | Large bullish candle |
| Second candle | Small candle inside first body | Small candle inside first body |
| Main message | Selling momentum may be weakening | Buying momentum may be weakening |
| Possible outcome | Bullish reversal | Bearish reversal |
| Confirmation | Bullish breakout / higher price action | Bearish breakdown / lower price action |
Final Thoughts
The Harami Candlestick Pattern is best understood as a sign of changing momentum rather than a guaranteed reversal signal.
A bullish Harami suggests that selling pressure may be weakening after a decline, while a bearish Harami suggests that buying momentum may be fading after an advance.
The pattern becomes considerably more useful when combined with market structure, support and resistance, volume, trend analysis, and confirmation from subsequent price action.
Instead of asking whether every Harami will reverse the market, traders should focus on a more useful question: does the surrounding price action provide enough evidence that control is actually shifting from buyers to sellers or from sellers to buyers?