Inverted Head and Shoulders
The inverted head and shoulders is one of the most reliable and powerful reversal chart patterns in technical analysis. This bullish formation often appears at the end of a downtrend and signals a potential shift from bearish to bullish momentum. Traders widely recognize it as a strong buying opportunity when it forms correctly.
What Is the Inverted Head and Shoulders Pattern?
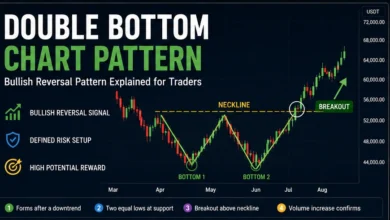
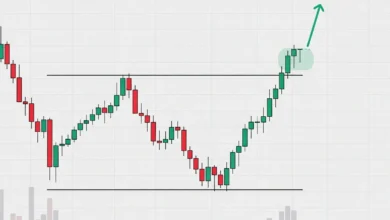
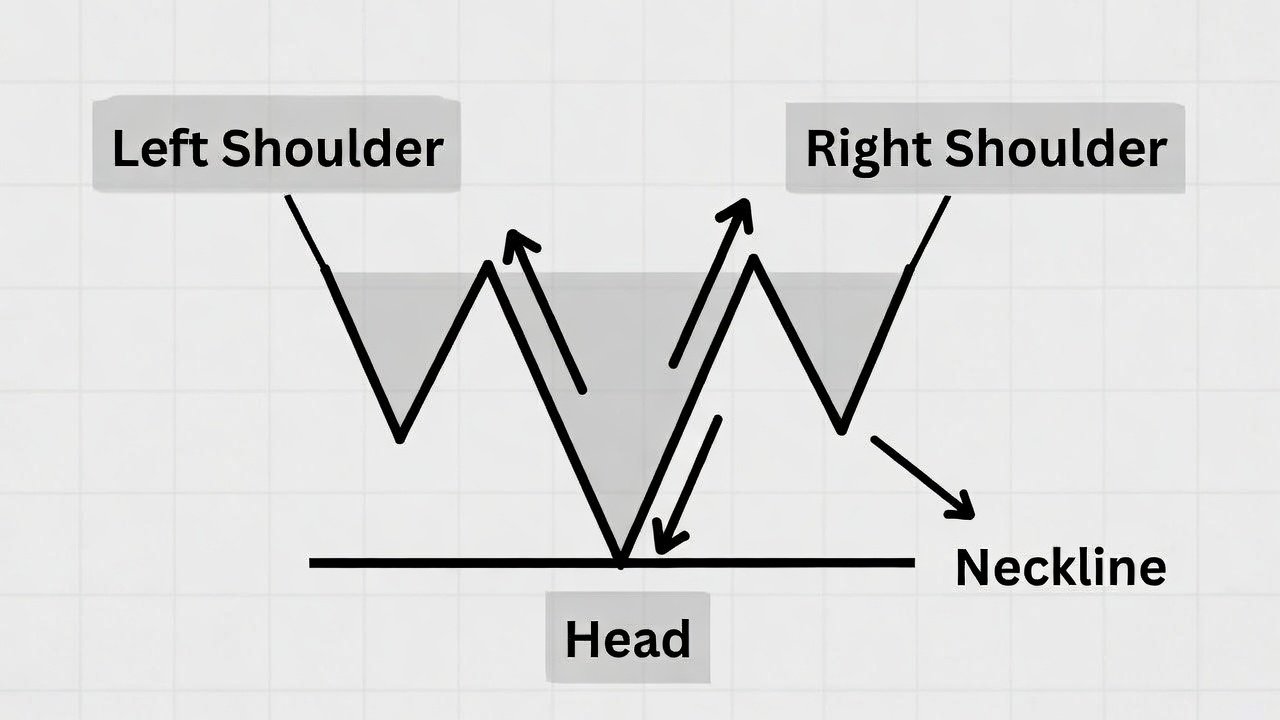
The inverted head and shoulders pattern consists of three troughs on the price chart. The middle trough, known as the head, is the deepest, while the two side troughs, called the shoulders, are roughly at the same level and shallower than the head. This structure looks like an upside-down version of the classic head and shoulders pattern.
It typically develops after an extended downtrend. The left shoulder forms first with a decline followed by a rally. Then comes the deeper head, which often represents the final wave of selling pressure. Finally, the right shoulder completes the formation with another decline that fails to make a new low.
How the Inverted Head and Shoulders Forms
The formation process unfolds in distinct stages. During the left shoulder, prices fall and then recover partially. The head follows with a stronger decline, creating the lowest point. After the head, prices rally again before forming the right shoulder, which is usually similar in depth to the left shoulder.
Volume behavior plays a crucial role in confirming the pattern. Volume tends to be higher on the left shoulder, may decrease during the head, and then increases noticeably on the right shoulder as buyers step in. This shift in volume indicates growing bullish interest and adds credibility to the setup.
The Neckline and Breakout
The neckline is the most important element of the inverted head and shoulders pattern. It connects the high points between the left shoulder and the head, and then between the head and the right shoulder. The neckline can be horizontal or slightly upward sloping.
The pattern is considered complete only when the price breaks above the neckline with conviction. This breakout often occurs on increasing volume, which confirms the shift in market control from sellers to buyers. Once broken, the neckline frequently acts as support on any future pullback.
Measuring the Price Target
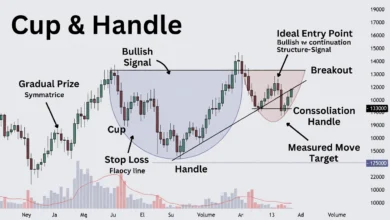
Traders use a simple measurement technique to project the potential upside after the breakout. The height of the pattern is calculated by measuring the vertical distance from the bottom of the head to the neckline. This same distance is then projected upward from the breakout point on the neckline.
This projected target provides a minimum expectation for the move. In strong bull markets, the actual price advance can exceed this target significantly. However, it is wise to use the measured move as a reference while monitoring the price action closely.
Advantages of the Inverted Head and Shoulders Pattern
One of the biggest advantages of the inverted head and shoulders is its relatively high success rate compared to many other chart patterns. It tends to produce fewer false breakouts when confirmed properly. The clear structure also makes it easier for traders to identify entry points, stop-loss levels, and profit targets.
Additionally, the pattern offers a favorable risk-reward ratio. Stop-loss can be placed just below the head, keeping the risk limited while the potential reward is substantial based on the measured move.
Real-World Examples in Markets
The inverted head and shoulders pattern has appeared in many major assets across different markets. It was visible in several blue-chip stocks during market recoveries, in major currency pairs in forex, and notably in cryptocurrencies during bullish reversals. For instance, some major coins showed this formation before significant rallies in previous cycles.
To spot the pattern early, it is best to analyze daily or weekly charts rather than very short timeframes. Higher timeframes filter out market noise and provide more reliable signals.
Confirming the Pattern with Technical Indicators
While the inverted head and shoulders can stand alone, combining it with other indicators improves accuracy. Look for bullish divergence on the RSI, where price makes lower lows but the oscillator makes higher lows. A crossover in MACD or the price crossing above key moving averages can also strengthen the signal.
Volume confirmation remains essential. A sharp increase in volume during the neckline breakout significantly boosts the probability of a successful move.
Trading Strategy with Inverted Head and Shoulders
When you identify this chart pattern, avoid jumping in too early. Wait for a decisive breakout above the neckline. Some traders prefer to enter on a pullback to the neckline after the breakout, which can offer a better risk-reward entry.
Place your stop-loss below the head to protect against pattern failure. As the price moves higher, trail your stop or take partial profits at the measured target. This disciplined approach helps traders capitalize on the bullish reversal signaled by the inverted head and shoulders.
Mastering this pattern enhances your ability to spot trend reversals and improves overall technical analysis skills. With practice, you will recognize high-probability setups more quickly and trade them with greater confidence.