
How to Read Flag Patterns in Trading Without Getting Faked Out
You see a sharp move up, then price pulls back into a tight, sloped little box that drifts against the trend for a few candles. Is that a flag setting up for continuation, or is it the first sign the move is over? That question is where most traders lose money on this pattern — not because they can’t spot it, but because they treat every consolidation after a big move as a flag.
This post breaks down what a flag pattern actually is, why the move before the flag matters more than the flag itself, and where traders typically get faked out.
What a Flag Pattern Actually Is
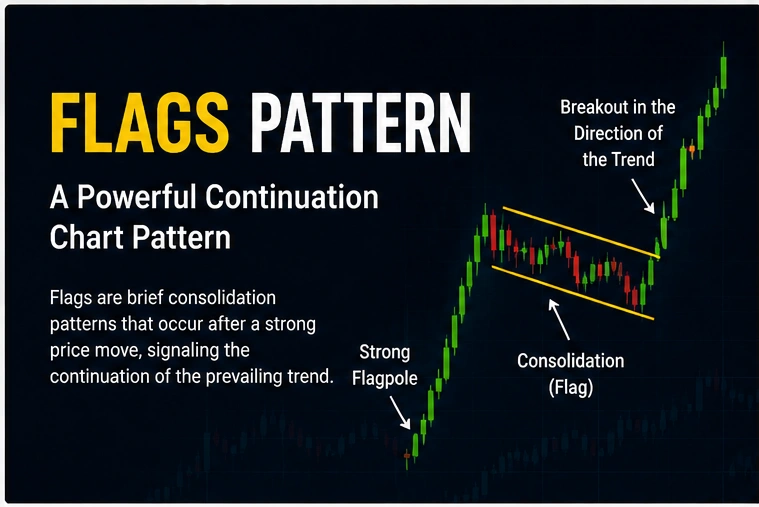
A flag pattern has two parts: the flagpole (a strong, fast directional move) and the flag (a short, controlled pullback that moves against the trend in a narrow, parallel channel). The pattern completes when price breaks out of the flag in the same direction as the flagpole.
The name comes from the shape — a straight pole followed by a small rectangular or slightly sloped flag. But the shape is the least important part. What separates a real flag from random noise is the behavior inside it: tight range, shrinking candles, and — ideally — declining volume.
Bull Flag vs. Bear Flag
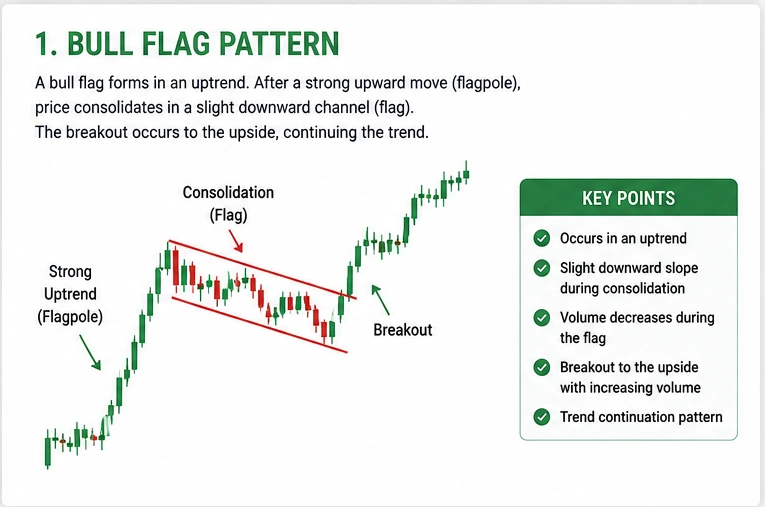
A bull flag forms after a sharp rally. The pullback slopes down or sideways, and the expected breakout is upward, continuing the original trend.
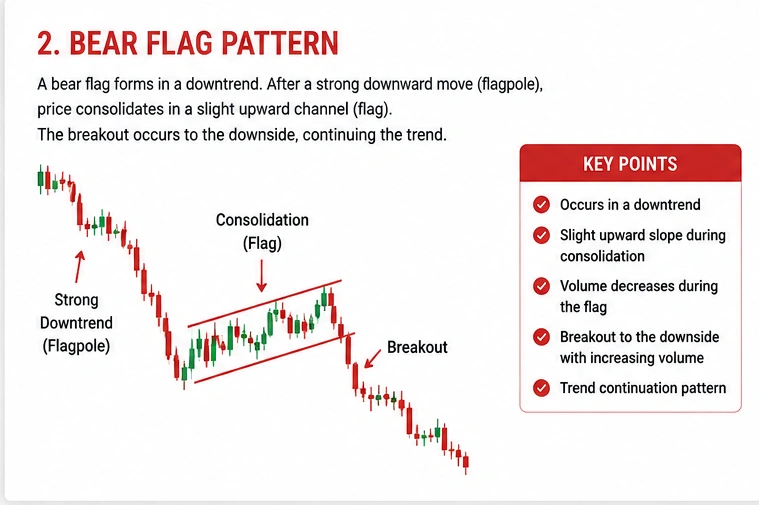
A bear flag forms after a sharp decline. The pullback slopes up or sideways, and the expected breakout is downward, continuing the decline.
The mechanics are mirrored, but bear flags tend to resolve faster in most markets, since sharp declines are often driven by forced selling rather than gradual accumulation. That’s a generalization, not a rule — it depends heavily on the asset and the timeframe you’re trading.
Why the Flagpole Matters More Than the Flag
Traders spend most of their attention on the flag itself — drawing the channel lines, watching for the breakout candle. But the flagpole is what gives the pattern its statistical edge. A flag that follows a weak, choppy move up isn’t really a flag; it’s just a pause in an already indecisive market.
A flagpole worth trading usually has:
A clear, near-vertical move with few pullbacks inside it
Volume noticeably higher than the average of the prior sessions
A move that covers meaningful distance in a short number of candles
If the “pole” looks more like a gentle slope than a sharp move, the pattern that follows is closer to a channel or a wedge than a true flag, and the continuation odds are weaker.
Volume Behavior Inside the Flag
This is the part most beginner explanations skip. In a textbook flag, volume should contract during the consolidation and then expand again on the breakout. Volume that stays high or keeps climbing during the flag is a warning sign — it often means the pullback is being driven by real selling (in a bull flag) or real buying (in a bear flag) pressure, not just profit-taking from early participants.
Trader’s note: One pattern that shows up a lot on lower timeframes is a bull flag with volume that never really drops off during the consolidation. It still looks like a textbook flag on the price chart, but the volume tells a different story — and more often than not, those setups either stall or reverse instead of continuing. Checking volume before the breakout, not just after it, changes how often this pattern actually plays out as expected.
Common Mistakes With Flag Patterns
Drawing a flag on a move that isn’t actually a strong flagpole. Any consolidation after any up move gets labeled a “bull flag” — most of them aren’t.
Entering on the first candle that pokes out of the channel. A single wick through the trendline isn’t a breakout; it’s often a stop-hunt.
Ignoring how long the flag has lasted. Flags that drag on for far longer than the flagpole took to form lose most of their statistical reliability — the longer the pause, the more it starts to resemble a range rather than a pattern in progress.
Trading the pattern in isolation. A flag against a larger resistance zone or a major trendline behaves very differently than the same shape in open air.
Setting Entries, Stops, and Targets
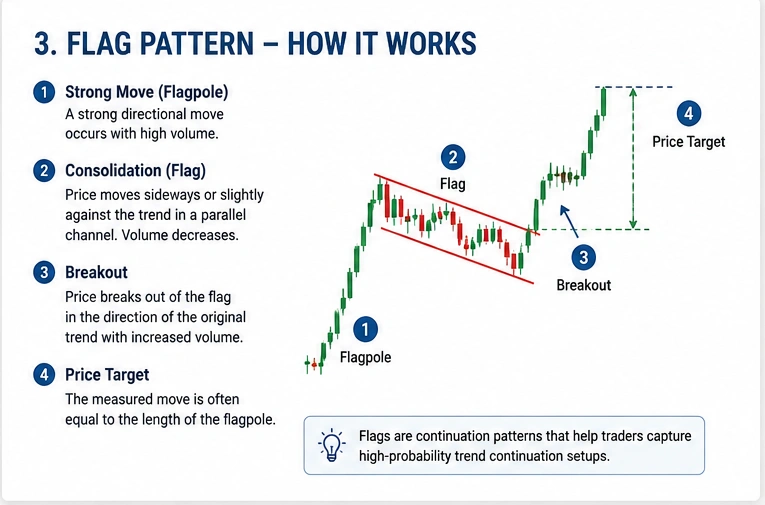
There’s no single “correct” way to trade a flag, but a few approaches are common:
Entry: either on a confirmed close beyond the flag’s trendline, or on a retest of that trendline after the breakout.
Stop-loss: typically placed just beyond the opposite side of the flag channel, not at the exact trendline, to allow for normal noise.
Target: the most common method measures the length of the flagpole and projects that same distance from the breakout point (“measured move”). It’s a starting reference, not a guarantee — actual targets should account for nearby support/resistance.
When Flags Fail
Flags fail more often in choppy, low-volume markets and around major news events, where the “pause” isn’t controlled consolidation but simple indecision. A failed flag usually shows one of two signs early: the breakout happens on weak volume, or price breaks out and immediately reverses back inside the channel (sometimes called a failed breakout or a bull/bear trap). Waiting for a candle to close outside the channel, rather than reacting to an intrabar move, filters out a large share of these false signals.
Who This Pattern Actually Suits
Flag patterns are more useful to traders working on shorter timeframes with clearly trending assets — they’re a continuation tool, not a reversal signal. In a sideways or heavily range-bound market, flags are harder to identify reliably and produce more false signals. Traders relying purely on long-term, buy-and-hold positioning generally get little use out of this pattern, since it’s built around short-term continuation, not long-term direction.
Frequently Asked Questions
Is a flag pattern bullish or bearish?
Neither by default — it depends on the direction of the flagpole. A bull flag continues an uptrend; a bear flag continues a downtrend.
How long should a flag pattern last?
There’s no fixed rule, but most reliable flags resolve within a few to several candles relative to the timeframe you’re trading. If the consolidation drags on far longer than the flagpole took to form, it’s behaving more like a range than a flag.
What’s the difference between a flag and a pennant?
A flag consolidates in a roughly parallel, rectangular channel. A pennant consolidates in a converging triangle shape. Both follow the same flagpole logic and are usually treated similarly.
Can flag patterns fail?
Yes, regularly. Weak-volume breakouts and breakouts that immediately reverse are the two most common failure signs.
Do flag patterns work on all timeframes?
The pattern shows up on any timeframe, but reliability tends to depend more on how clean the flagpole is than on the specific timeframe. A messy flagpole produces an unreliable flag regardless of whether it’s on a 5-minute or a daily chart.