1 day ago

    Harami Candlestick Pattern: What It Is and How to Trade It

    The harami candlestick pattern is a two candlestick pattern that may signal a pause or reversal in price momentum. It…
    1 week ago

    What Is RSI? How to Use the Relative Strength Index in Trading

    What Is the RSI Indicator? The RSI indicator, short for Relative Strength Index, is one of the most widely used…
    1 week ago

    What Is the Stochastic Oscillator? A Complete Guide for Technical Traders

    What Is the Stochastic Oscillator? The stochastic oscillator is one of the most popular momentum indicators used in technical analysis.…
    2 weeks ago

    What Is Average True Range and How Do Traders Use It

    Average True Range Explained: How Traders Use ATR to Manage Volatility Volatility is the heartbeat of every market. Without understanding…
    2 weeks ago

    Double Bottom Chart Pattern Explained for Traders

    The double bottom chart pattern is one of the most popular bullish reversal formations used in technical analysis. Traders rely…
    2 weeks ago

    Double Top Pattern: Complete Guide to This Bearish Reversal Signal

    What Is a Double Top Pattern? A double top pattern is a bearish reversal pattern that usually forms after a…

    What is Support and Resistance in Trading? Explained for Beginners

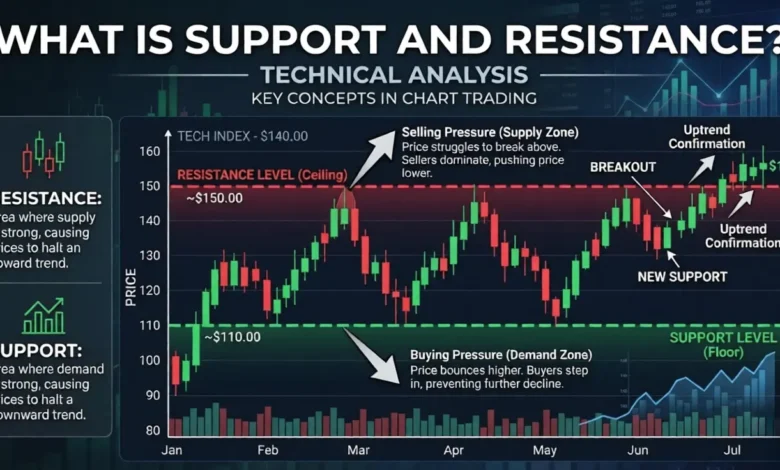
    Support and resistance is one of the most important concepts in technical analysis. If you…

    Read More »

    What Is the Dow Theory?

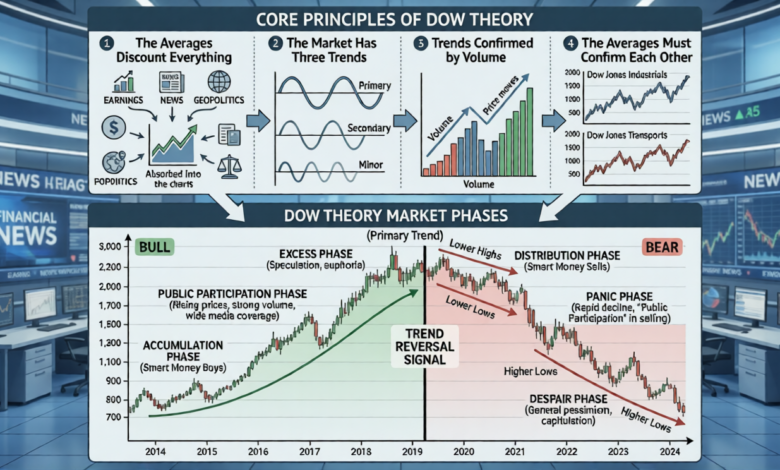
    Introduction to Dow Theory The Dow Theory is one of the oldest and most important…

    Read More »

    Technical Analysis for Beginners

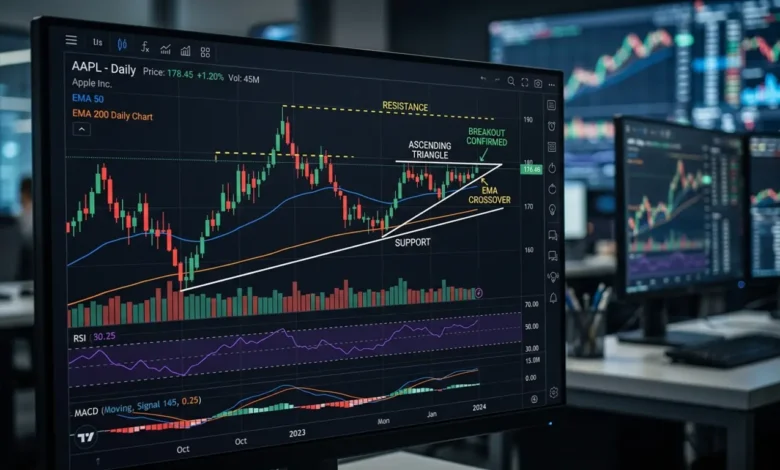
    Technical analysis is a method used to evaluate financial markets by analyzing price charts, patterns,…

    Read More »
    Back to top button