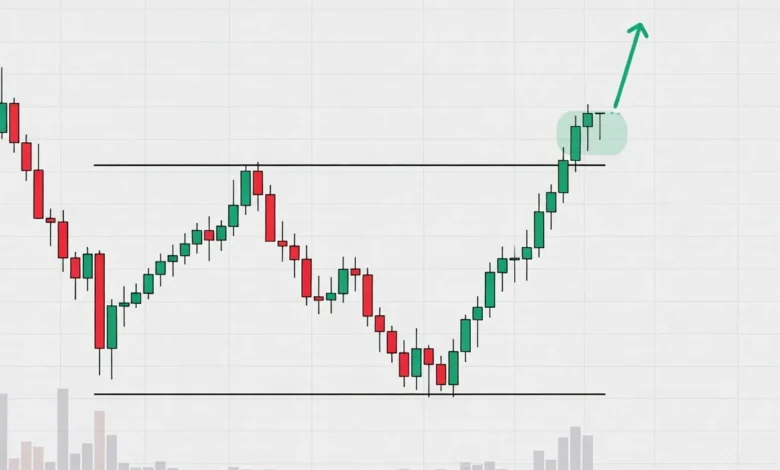
The rectangle pattern ranks among the clearest and most reliable formations in technical analysis. It…
Read More »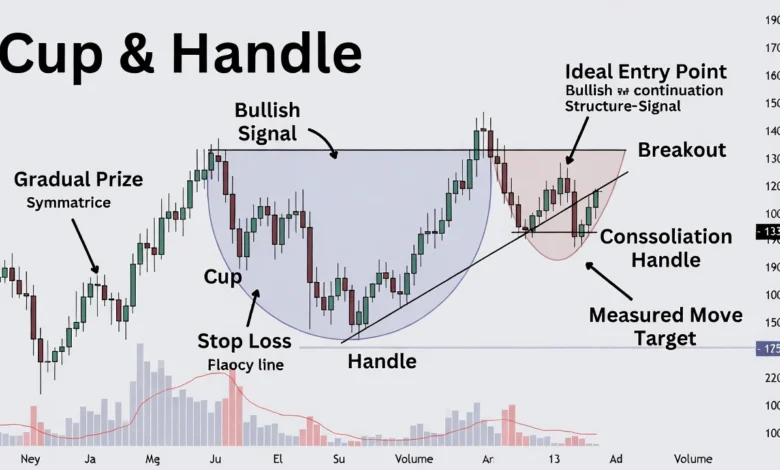
The cup and handle pattern is one of the most reliable bullish continuation setups in…
Read More »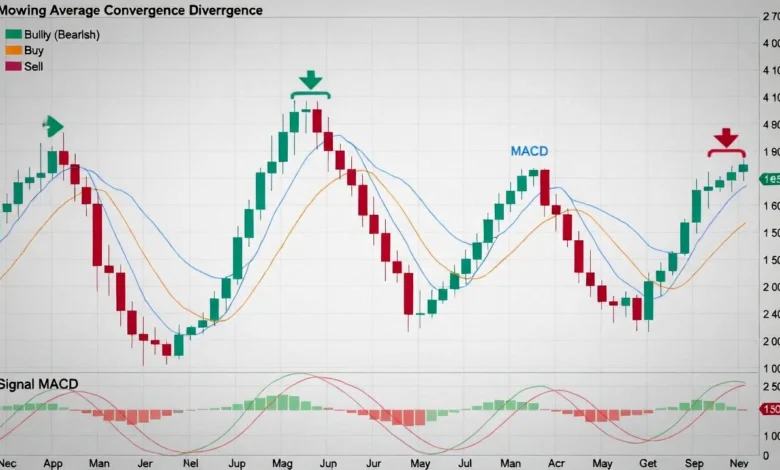
The MACD, or Moving Average Convergence Divergence, stands as one of the most popular momentum…
Read More »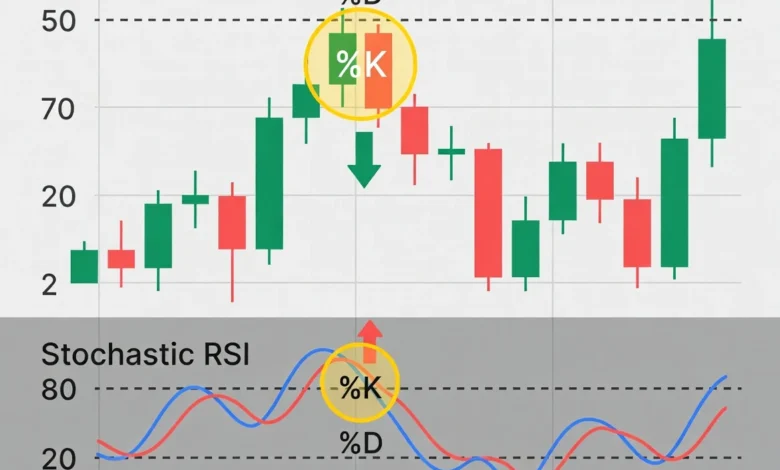
The Stochastic RSI combines the strengths of the Relative Strength Index and the Stochastic Oscillator…
Read More »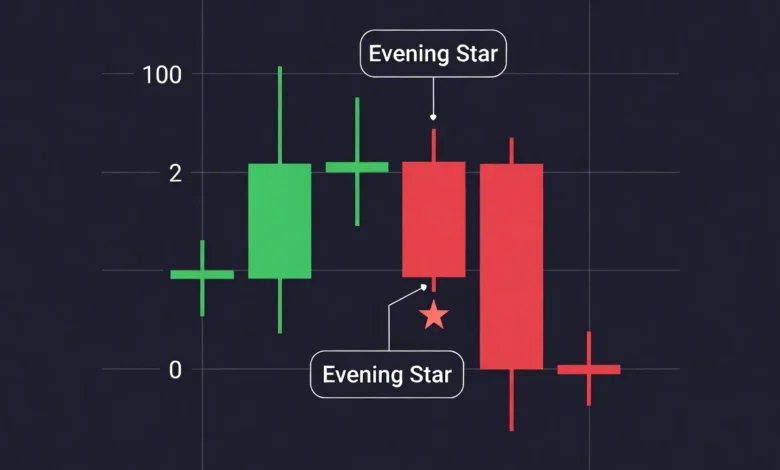
The Evening Star stands as one of the most reliable bearish reversal signals in technical…
Read More »
What is the Morning Star Candlestick Pattern? The Morning Star candlestick pattern is a bullish…
Read More »
The Doji candlestick stands as one of the clearest signals of market hesitation in technical…
Read More »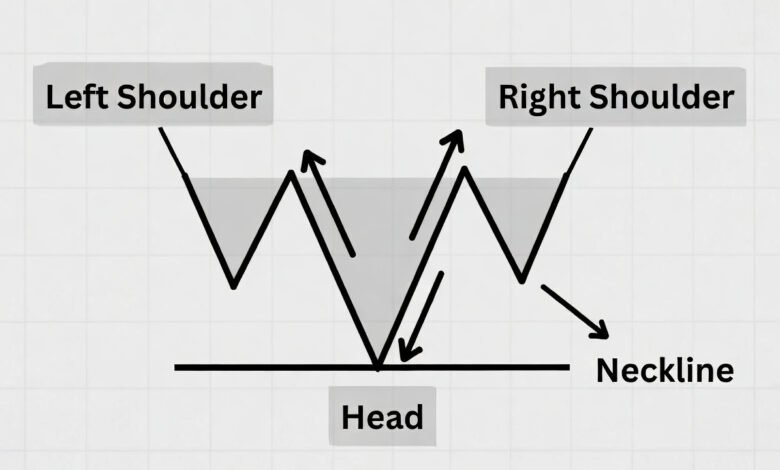
Inverted Head and Shoulders The inverted head and shoulders is one of the most reliable…
Read More »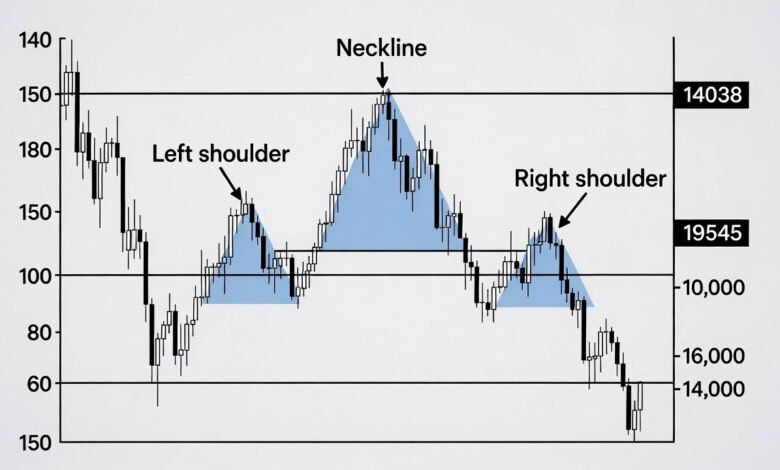
The Head and Shoulders pattern is one of the most reliable and widely used reversal…
Read More »