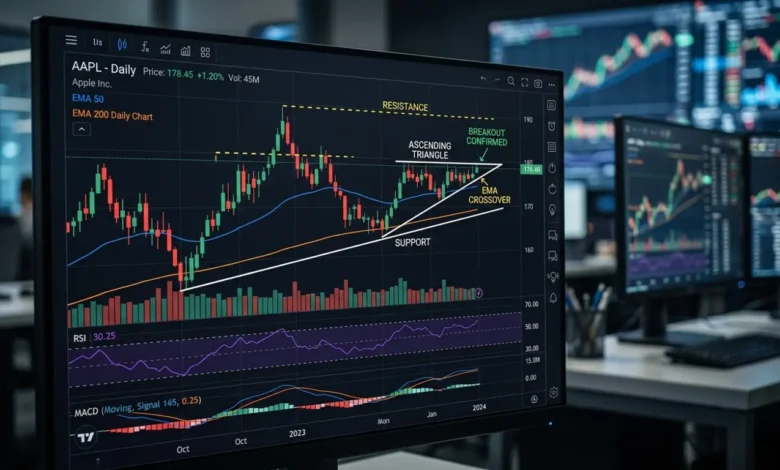
Technical analysis is a method used to evaluate financial markets by analyzing price charts, patterns,…

Read More »3 days ago
Harami Candlestick Pattern
The Harami Candlestick Pattern is a two-candle formation that can signal weakening momentum and a possible change in market direction.…
2 weeks ago
Accumulation Distribution
Accumulation Distribution Indicator: How to Read the A/D Line A stock can continue making higher highs even as the volume…
2 weeks ago
Breakout and Pullback: How to Confirm and Trade Price Moves
Breakout and Pullback trading involves identifying price movements beyond key support or resistance levels and evaluating subsequent retracements. However, not…
2 weeks ago
Volume in Trading: How to Analyze Market Activity
A price breakout can look convincing on a chart, yet the trading volume behind it may tell a different story.…
July 14, 2026
How to Read Flag Patterns in Trading
How to Read Flag Patterns in Trading Without Getting Faked Out flags patterns — You see a sharp move up,…
July 13, 2026
Parabolic SAR Indicator: How to Use It Correctly
Most traders open a chart and treat the dots flipping from below price to above price as a clean sell…
June 28, 2026
Marubozu Candlestick Pattern: What It Means and How to Trade It
What Is a Marubozu Candlestick? A marubozu candlestick is a strong momentum candle with little or no wick. It usually…
June 26, 2026
Harami Candlestick Pattern: What It Is and How to Trade It
The harami candlestick pattern is a two candlestick pattern that may signal a pause or reversal in price momentum. It…